The Results Explorer enables exploring the element force and moment results (internal loads) from solver result files (grid point forces) for further component sizing/optimization tasks and also for component certification/margin calculation. The goal is not to replace the HyperView general functionality for stress/strain results viewing by this tool, but to complement by linking HyperView and HyperMesh together for component certification. You can evaluate critical load cases (Min/Max, Ranking, Envelop) to design/optimize the components using this tool. The Results Explorer tool is linked to Microsoft Excel for report generation.
The internal loads calculated using this tool are:
| • | Element forces (Nx, Ny, Nxy, Mx, My,Mxy) |
| • | Moments and shear/free body diagram |
This tool also accesses results from multiple results files, and performs derived load cases created by linear superposition of existing load cases using a load combination file (LCF).
| • | Default case: You can create a report of element loads for selected load cases |
| • | Min/max: You can find the elements where maximum or minimum values of select result components and the corresponding load cases at which they occur |
| • | Ranking: Given selected elements and load cases, you can find the top N elements where a given results type can occur |
| • | Envelop: For a given element, you can find the maximum values of a results type and its load case at which it occurs |
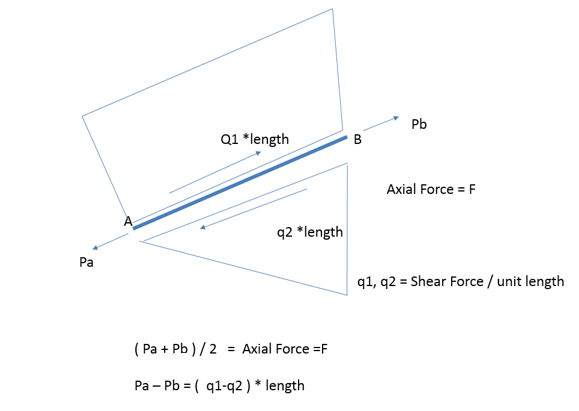
| • | Bar End Load: Adjusted axis force at each end of the bar due to panel shear |
| • | Shear Flow Plot: Shear forces acting along the edge of a panel element |
|
The use of the load combination file is to combine load cases and create new load cases (derived cases).
Derived case (D1) = L1 *SC1+L2*SC2+...
where L1, L2 are load cases from solver runs and SC1, SC2 are scale factors. The file format is as follows:
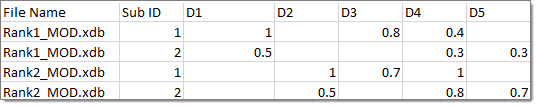
In this example D4 (derived case) = LC1*0.4+LC2*0.3+LC3*1+LC4*0.8
|
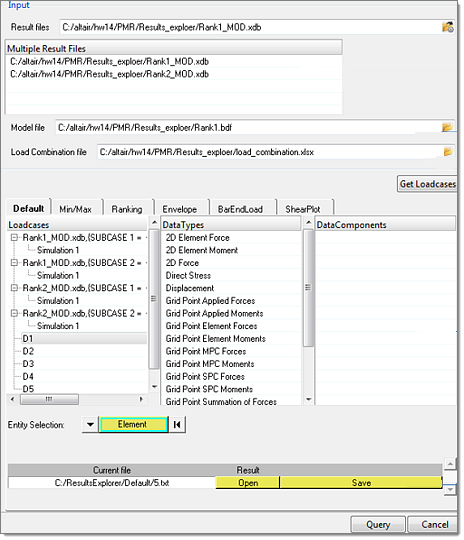
Before using this tool, you need to access the results files, model files and the select load cases. This is done in the following sequence:
| 1. | Select the results file. |
| 2. | Select a single FE model file that has the same elements/nodes as the results file (.dat, .bdf or .inp). |
| 3. | Select the load combination file, only if you need load combination. If you are using the default no files are needed. |
| 4. | Click Get Loadcases. The results files are opened, and the derived load cases are calculated (if the LCF file was provided), and all of the load cases for selection for the use cases are displayed. |
|
In this case the raw results exported to an Excel file are for the selected elements, selected load cases and the results type.
| 3. | Select the result data type. |
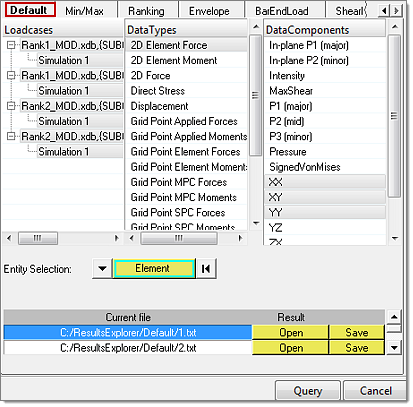
Separate files are created for each load case
|
The minimum and maximum values are searched for all of the load cases for the selected elements.
| 2. | Select the element forces/stress. |
| 3. | Select multiple data types for the max/min, which is required. |
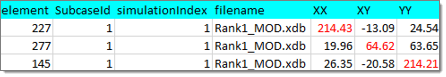
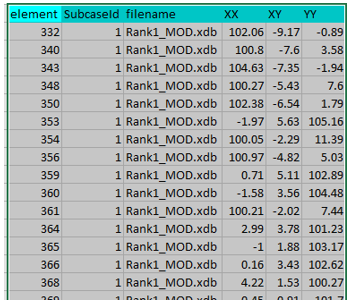
This image shows the maximum XX, XY, YY data types and the rest of the corresponding components in that load case
|
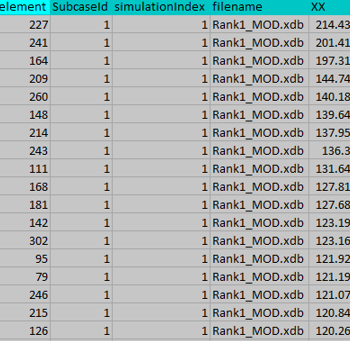
The goal of this use case is to find the top N values (rank=N) of a specific results data type and report for which element and load case they occur.
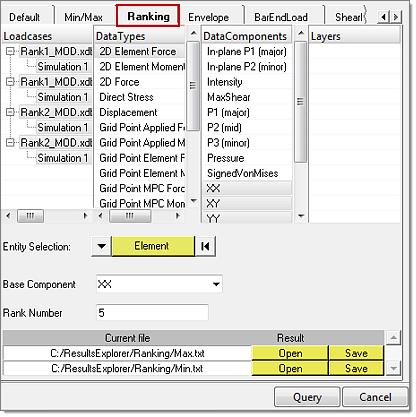
This image shows the ranking of the top five values for the component XX
| 1. | Select the base element results. |
| 2. | Select the rank, which is the top N maximum results. The output displays the top N results, their elements and load cases. Other associated data components are also displayed, such as XX, YY. |
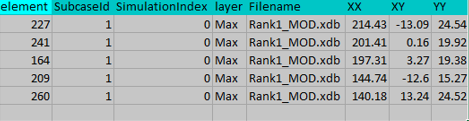
This image shows the top five values of XX components and element/load cases
|
The Envelop tool outputs for each element the maximum values of selected results data type and the corresponding load case where it occurs. You can select one data type at a time.
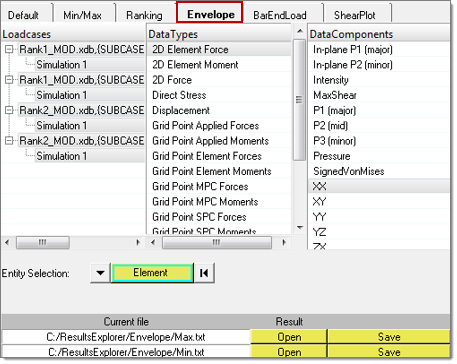
You select the single data component and load cases
For each element the maximum XX component and the load case where it occurs is exported
|
Bar End Load: In bar element the axial force at each end is increased or decreased due to the shear forces acting along the side of the shell elements attached to them. These end loads are used in certification calculations.
Edge Shear Flow: It is often useful to calculate the shear load acting along each edge of a shell element for rivet load calculation or bar end load calculations. This is output as force per unit length.
Output: Each load case is displayed in the graphics window for each element
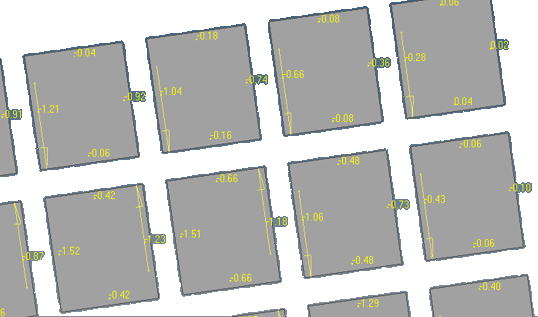
Shear flow is shown on each element edge
|
See Also:
Aerospace Menu


