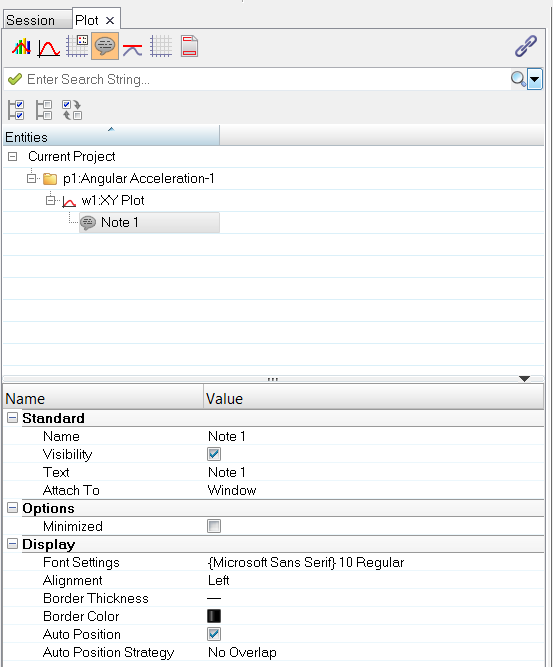
The Notes View,  , displays only the notes in the session, grouped within their respective page and plot folders. Clicking on a note displays the note's properties in the Properties Table

Note properties, when note it is attached to a window
When a note is selected, the following fields are displayed in the Properties Table:
Standard
| • | Name - displays the name of the note. |
| • | Visibility - select this option to display the note in the plot window. |
| • | Text - the note text or Templex expression in the note. |
| • | Attach To - Select where the note will be attached. Options include Window, View, Curve, and Coordinates. |
When Curve is selected as the Attach To method, alternate options are displayed under Standard:
| • | Attachment Curve - displays the name of the curve that the note is attached to. |
| • | Attachment Point - the point value or location of the note's attachment point on the curve. |
When Coordinates is selected as the Attach To method,
| • | Attachment X Coordinate - the x coordinate value for the note's attachment point. |
| • | Attachment Y Coordinate - the y coordinate value for the note's attachment point. |
Display
| • | Font settings and alignment |
| • | Border thickness and color |
| • | Auto Position and Auto Position Strategy. See Note Positioning for more information on this feature. |
| • | Curve Color (displayed when a note is attached to a curve) – By default, note text is black. Select a note from the browser and activate Curve Color to make the note text the same color as the curve’s color. When you select Curve Color, the Border Color option disappears and the border around the note becomes yellow. If you change the Line Color of the curve while Curve Color is selected, the note color changes as well. |
Options
| • | See Mouse Over Notes for more information on the features in the Options section. |


![]() , displays only the notes in the session, grouped within their respective page and plot folders. Clicking on a note displays the note's properties in the Properties Table
, displays only the notes in the session, grouped within their respective page and plot folders. Clicking on a note displays the note's properties in the Properties Table