Element Quality View |

|

|

|

|
|
Element Quality View |

|

|

|

|
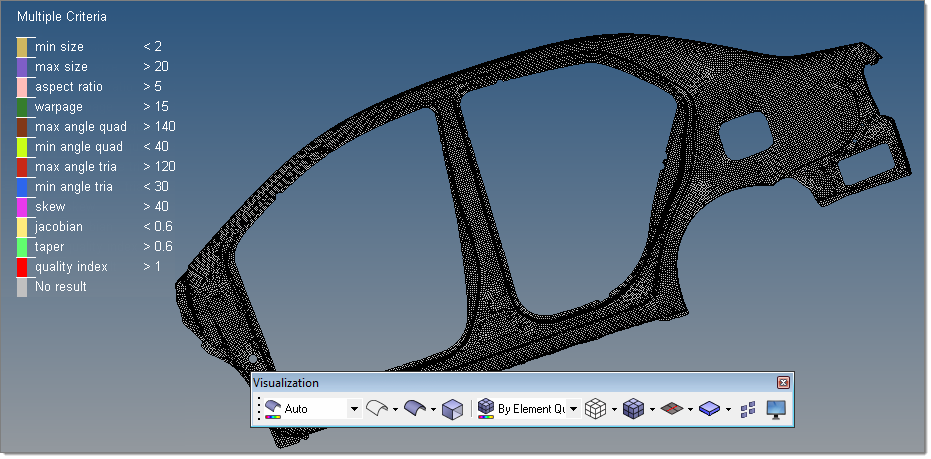
Element Quality View is a permanent visualization mode that HyperMesh displays in the upper left-hand corner of the graphics area when you select By Element Quality on the Visualization toolbar. Use this tool to investigate each specific element criteria, view a breakdown of all failed and worst elements, resolve all criteria violations at one time, and evaluate the over all quality of a mesh.

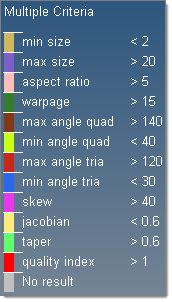
When you select Element Quality View, HyperMesh displays the Multiple Criteria legend by default.

In this legend, you can:
| • | Review the different 2D element criteria's. |
| • | Adjust the initial threshold values assigned to each 2D element criteria. |
| • | Select specific criteria's to investigate further. |
The Element Quality View tool bases the initial threshold values on the ideal, good, warn, fail (default), and worst values that are defined in the current 2D element criteria settings. By default, this tool bases the initial threshold values on the fail column. You can directly edit these values from the Element Quality View or you can edit them in the Criteria File Editor.
|
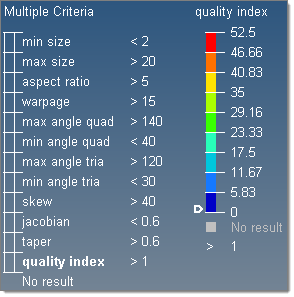
When you click a criteria in the Multiple Criteria legend, a single criteria specific legend appears to the right of the threshold values. The elements are color coded according to how well they adhere to the quality requirements in the graphics area.
Each 2D element criteria, in the Multiple Criteria legend, has its own single criteria legend. The single criteria legends consists of a color coded sliding scale, which you can use to evaluate the elements in the graphics area and resolve all criteria violations.

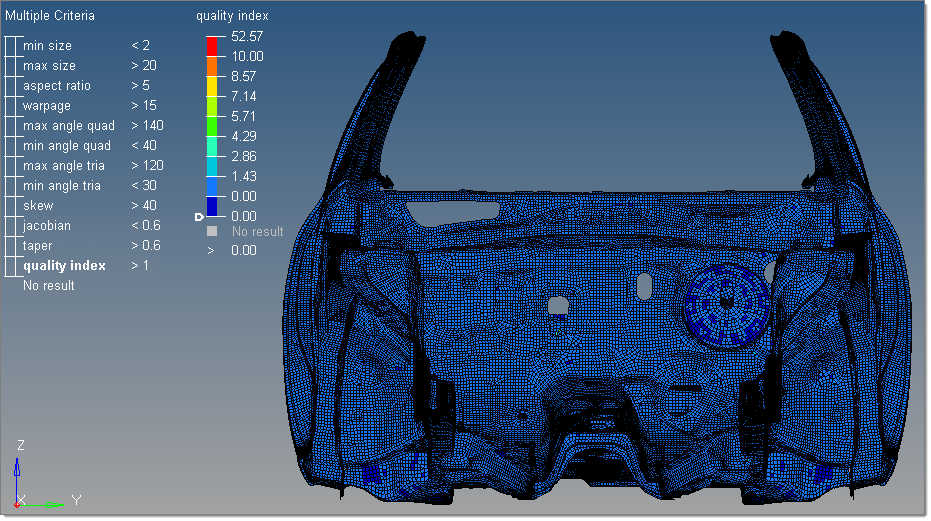
The colors exhibited in the sliding scale reflect the quality of each element in the graphics area. The elements that are of the best quality will always display in blue, whereas, the elements that are of the worst quality will always display in red. The Element Quality View tool determines the quality of each element using the 2D element criteria that you defined in the Multiple Criteria legend.

The Element Quality View tool always lists the values in the sliding scale from low to high, with the lowest value always being at the bottom of the scale and the highest value always being at the top. This tool always defines the first and last values in the legend with the minimum and maximum values. You cannot edit the minimum and maximum values.
The second and second to last values are the initial legend range coverage, based on the good to worst, warn to worst (default), fail to worst, and min to max values. These values are taken from the criteria file, and can be edited. The Element Quality View tool interpolates the values in between these.
Each single criteria legend contains a slider that is located, by default, at the exact, current threshold position. If the initial legend range coverage does not provide the threshold value set defined in the settings, then the slider will be positioned to the closest available value. To view a breakdown of all of the failed and worse elements, move the slider up and down.
Element Quality View Context Menus