|
»Click here to display Table of Contents«
|
Integrity
|

|

|

|

|
|
Integrity
|
|
|
|

|
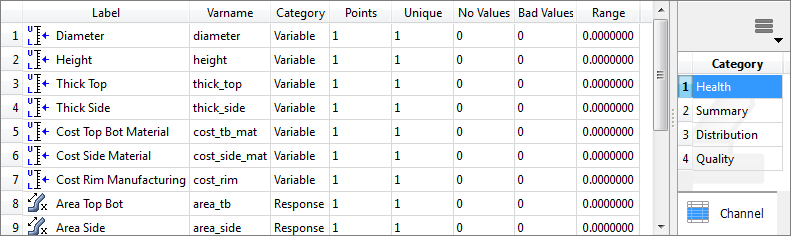
The Integrity tab contains a series of statistical measures on input variables and output responses.
| • | Health. High level summary of statistics used to easily spot inconsistent, non-changing, or missing data. |
| • | Summary. Basic descriptive statistics that presents information on the data in groups such as quartiles or ranges. |
| • | Distribution. Detailed descriptive statistics used to quantitatively describe the distribution of data points. |
| • | Quality. Values typically used in Quality Engineering. |
The following statistical indicators for output responses are displayed in the Integrity table columns.
Column |
Description |
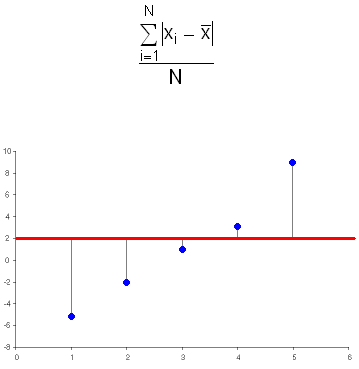
Average deviation |
Evaluated using the following expression:
The horizontal line in the above plot represents the average of the values in the vector. The vertical lines represent the differences between the values of the vector and the average of the values. The average deviation is the average difference between the vector elements and the average of the vector elements. The sign of each element is not taken into consideration when calculating the deviation. The sign of each element is taken into consideration when calculating the average of the elements. |
Coefficient of Variation (COV) |
A measure of relative dispersion given by:
The use of variation lies partly in the fact that the mean and standard deviation tend to change together in many experiments. The higher the CoV, the higher the variability. The lower the CoV, the less the variability of the data. CoV is seldom of interest where the mean is likely to be near zero. |
Kurtosis |
Measure of flatness of a distribution. |
Lower Control Limit (LCL) |
Mean - 3*standard_deviation |
Maximum |
Maximum value indicates the largest of all output response values. |
Mean |
Indicates the most probable value the output response would take. |
Median |
The median of a scalar is that value itself. The median of a vector with an odd number of elements is a scalar that is the element at the center of the ordered vector (element (N+1)/2, where N is the number of elements). The median of a vector with an even number of elements is a scalar that is the average value of the two elements closest to the center of the ordered vector (elements N/2 and (N+2)/2, where N is the number of elements). |
Minimum |
Minimum value indicates the smallest of all output response values. |
RMS |
Calculates the square root of the mean of the sum of the squares of all output response values using the following equation:
|
Skewness |
Indicates whether the probability distribution is skewed to the right or to the left. If the skewness is zero, the probability distribution is symmetric about the mean of the distribution. If the skewness is less than zero, the probability distribution is skewed to the left of the mean of the distribution. If the skewness is greater than zero, the probability distribution is skewed to the right of the mean of the distribution. |
Standard deviation |
This is the square root of the variance. It is a commonly used measure of dispersion. |
Upper Control Limit (UCL) |
Mean + 3*standard_deviation |
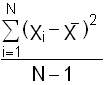
Variance |
Evaluated using the following expression:
|