In this tutorial, you will learn how to:
| • | Create a stress contour on all components using the Results Browser |
| • | Create a contour on specific elements using stress results |
| • | Create an averaged stress contour and generate iso surfaces |
| • | Create a Plot Style to be used in the Results Browser |
| • | Contour vector and tensor results resolved in different coordinate systems |
Tools
To access the Contour panel:
| • | Click the Contour panel button  on the Result toolbar. on the Result toolbar. |
OR
| • | Select Results > Plot > Contour from the menu bar. |

The Contour panel allows you to contour a model and graphically visualize the results. In the Contour panel you can view vector, tensor, or scalar type results.
To access the Results Browser:
| • | Select View > Browsers > HyperView > Results from the menu bar. |
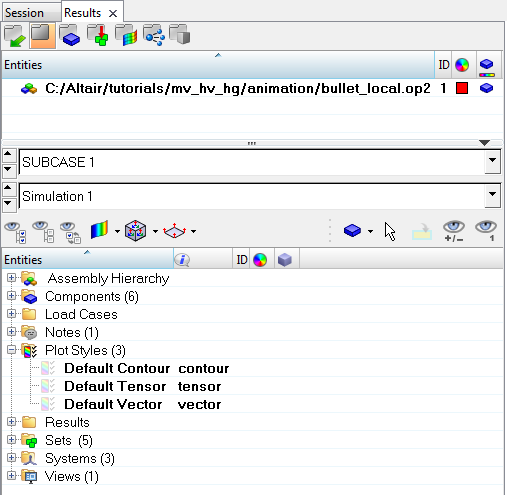
Exercise: Using the Contour Panel
This exercise uses the model file, bullet_local.op2.
Step 1: Create a Stress contour on all components using the Results Browser.
| 1. | Load the bullet_local.op2 file, located in the animation folder. |
| 2. | Open the Results Browser by selecting View > Browsers > HyperView > Results. |
| 3. | Expand the Results, Tensor, and Stress folders. |
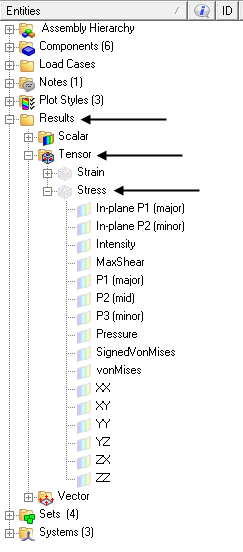
All available stress values are listed under the Stress folder.
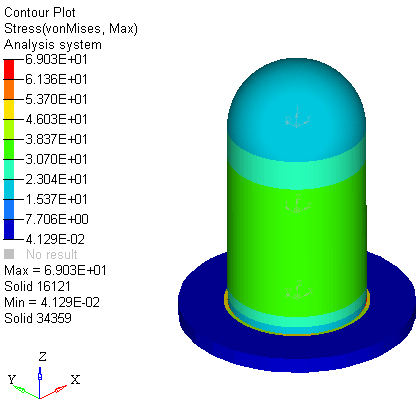
| 4. | Click on the icon next to vonMises. |
The contour is applied to the model in the graphics area.
Step 2: Alter the contour settings using the Contour panel.
| 1. | Click the Contour panel button  on the Result toolbar to enter the Contour panel. on the Result toolbar to enter the Contour panel. |

Using the Contour panel, additional options can be changed and applied to the contour.
| 2. | Select Z1 for Entity with Layers. |
The options for Entity with Layers are:
| - | Max displays the maximum values between layers Z1 and Z2. |
| - | Min displays the minimum values between layers Z1 and Z2. |
| - | Extreme displays the maximum absolute values among the layers for each entity. |
| - | Z1/Z2 displays the layers for thick shells. These will vary based on the solver type. |
| 3. | Verify that Resolved in is set to Analysis System and that the Averaging method is set to None. |
By default, the results are applied to all the model components displayed on the screen.
You can also select individual components from the model.
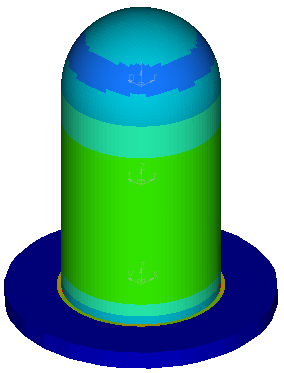
Step 3: Create a contour on specific elements using stress results.
| 1. | Change the active input collector from Components to Elements. |
| 2. | In the graphics area, pick a few elements on the model. |
| 4. | Press the SHIFT key and the left mouse button, and drag the mouse in the graphics area, to draw a window over a specific area of the model. |
The contour is applied to the elements that were chosen using the quick window mode.
This can be done for other entity types also.
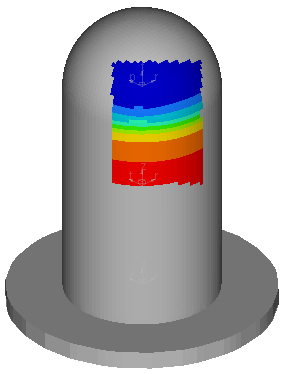
| 5. | Under Selection, click on Elements and choose All from the pop up selection window. |
Note If your solver supports corner data, Use corner data can be activated in order to view corner results.
Step 4: Create an averaged stress contour and generate iso surfaces.
| 1. | Change the Averaging Method to Simple. |
The color bands reflect the band settings for the legend.
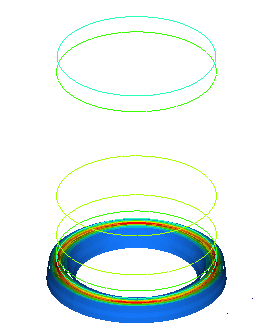
| 4. | Click in the graphics area and press ‘T’ on the keyboard. |
This allows you to view the iso surface while seeing the model in transparent mode.
| 5. | Press ‘T’ again to turn off transparency. |
| 7. | Click Create Plot Style. |
Creating a plot style allows you to save the current settings in the Contour panel so that they can be accessed later in the Results Browser.
| 8. | In the Create/Update Contour Plot Style dialog, enter Simple vonMises in the New plot style text field and click OK. |
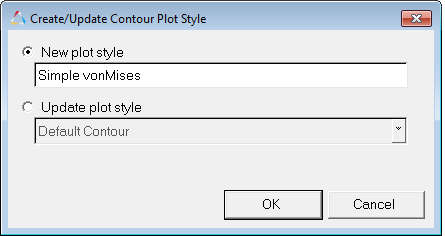
| 9. | In the Results Browser, expand the Plot Styles folder. |
Notice that Simple vonMises is now listed as a plot style.
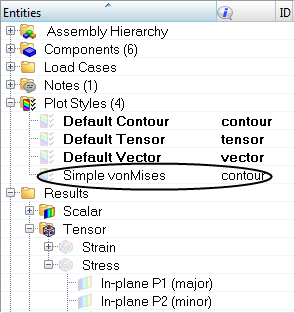
| 10. | Click on Default Contour (under Plot Styles) to contour the model with displacement results using the default contour plot style. |
Observe the updates in the Contour panel.
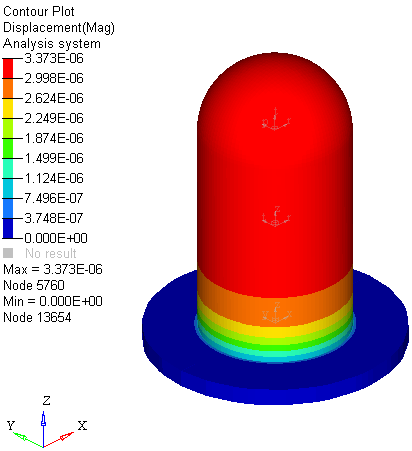
| 11. | Click on Simple vonMises (under Plot Styles) to return to the previous contour settings. |
| 12. | Right-click in the Results Browser and select Clear Plot > Contour to remove the contour plot. |
Step 5: Contour vector and tensor results resolved in different coordinate systems.
For vector and tensor results, you can transform the results to a different coordinate system.
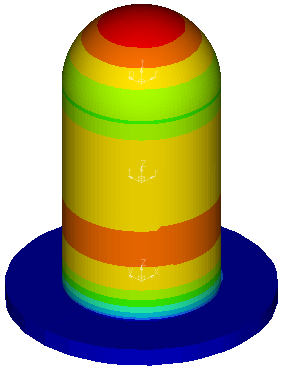
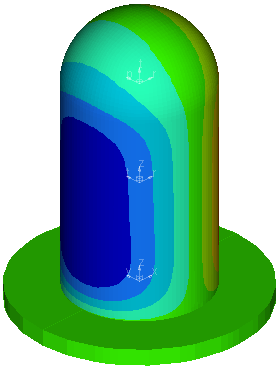
| 1. | Within the Contour panel, select Displacement (v) as the Result type and X as the Data component. |
| 2. | Select the Analysis coordinate system. |
| 4. | Change Resolved in to Global System (proj: none). |
|
|
Analysis system
|
Global system
|
| 7. | Change the result type to Stress (t) with vonMises as the data component. |
| 8. | Under Resolved in select User System (proj: none). |
| 9. | Click Projection Rule, select Projection (use projected axis as Sxx), and click OK. |
The current system changes to User System (proj: x, y).
| 10. | Click on System and then click on By ID. |
| 11. | Enter ‘2’ to choose the second user defined system, and click OK. |
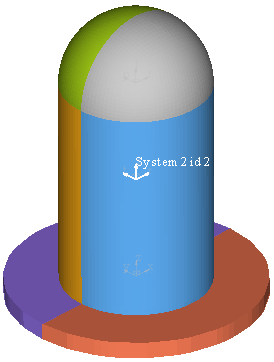
| 13. | From the Results Browser, select Simple vonMises (located under the Plot Styles folder) and observe the changes. |
Step 6: Edit the legend.
| 1. | Click Edit Legend to open the Edit Legend dialog. |
| 2. | Click on 4.514E+01 and change the value to 45.0. |
The numbers will automatically interpolate and change in the preview window.
Observe the legend changes in the graphics screen.
| 4. | Click Default to return to the default settings. |
| 5. | Click OK to close the dialog. |
See also
Contour Panel
HV-3030: Editing Legends
HV-3060: Transforming and Averaging Stresses
HyperView Tutorials for a complete list of HyperView tutorials


