The FLD panel allows you to a plot a Forming Limit Diagram (FLD) based on a material Forming Limit Curve (FLC) and the major and minor strain output results of a forming simulation. To access the panel, click the FLD icon  on the Tools toolbar, or select FLD from the Tools menu.
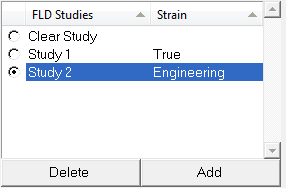
An FLD study consists of the HyperView and HyperGraph windows related to an FLC, FLD, and contour plot. Studies belonging to the current session are listed in the FLD Studies box along with the study type (Engineering or True).

FLD Studies list box
You can add, delete, rename, and select individual studies to be used to create a FLD. You can also select multiple FLD studies and click the Delete button, in order to delete the selected studies from the list.
Keyboard shortcuts are also available for selecting items within the list:
| • | Press the SHIFT or CTRL key on the keyboard + the left mouse button to select multiple items from the list. |
| • | Press the CTRL + A keys on the keyboard to select all items in the list. |
| • | Press the DELETE key on the keyboard to delete the selected study (or studies). |
A study is activated, or deactivated, using the radio button. When you select a study from the list, each relevant window is displayed.
In addition, you can access the following options by right-clicking anywhere within the Tracking Systems list:

| • | Delete - Deletes the selected study (or studies) from the list. |
| • | Rename - Displays the Rename dialog, which allows you to rename the selected study. |
| • | Make Current - Allows you to select which study will be activated and displayed in the graphics window. This option performs the same action as clicking the radio button "on" next to a study. |
You can sort the items in the FLD Studies list by clicking on one of the list headings.
Activating the Clear Study option clears the contour, and deactivates all of the studies listed.
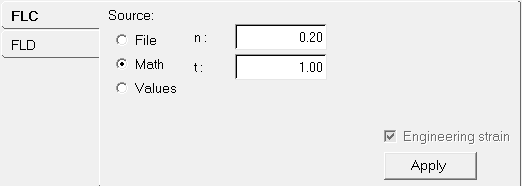
Use the FLC tab to define the forming limit curve that will be used to plot the forming limit diagram. The curve is defined by one of the following methods.

FLC tab
File
|
Load curve data from an existing file.
When using the File option, the file you are using must contain the header, XYDATA, material name and the footer, ENDDATA (all upper case). The data between the header and footer must be in two columns, separated by spaces.
|
Math
|
Mathematically define a curve in true strain metric by entering values for the strain hardening component (n) and material thickness (t).
Note: The following formula is used to calculate the fld0:
(0.23+0.146*t)*n/0.21
Where t is in mm.
|
Values
|
Define a curve from a set of x-y data points corresponding to the minor and major strains.
|
The Engineering check box allows you to assign a metric to the FLC data provided by File and Values. Activating the check box indicates that the metric used for the data is an Engineering Strain; otherwise a True Strain metric will be used.
Click Apply to apply the settings and define the curve. The curve along with the metric is displayed in the adjacent window.
|
Once a forming limit curve is defined, you can use it to plot a forming limit diagram and formability contours on a deformable material using the FLD tab.

FLD tab
Type
|
Allows you to define the metric for the FLD as True Strain or Engineering Strain. By default it is assigned the metric of the input FLC curve, however you can change the type at any instance by clicking Apply (the metric of FLD will then be updated along with data points and the FLC curve to the corresponding metric).
|
Selection
|
Before plotting an FLD, you must pick one or more components from the model. You can do this by picking entities directly from the screen, using the quick window selection, or clicking the Components input collector and using the extended entity selection menu. If no selection is made, all of the components will be used to create an FLD plot.
|
Result type
|
The Result type section selects Strain as the result data type that is used to plot the FLD.
The second drop-down menu in the Result type section allows you to select the layer at which the FLD is being created.
|
Display
|
Zone contour
|
Creates a formability contour based on the deformation mode, which is derived from the ratio of major and minor strains.
|
|
Distance contour
|
Creates a formability contour based on the distance of each strain pair from the FLC.
|
The following options can be activated using the check boxes:
Shear line
|
Use Angle
|
Set the angle of the Shear line with respect to the minor strain axis. 45 degrees is the default angle. This definition is always in a True Strain metric; HyperView will automatically convert them if the FLD Type is set to Engineering Strain.
|
|
Use File
|
Select a file which contains the Shear line data in xy format. The metric of data needs to be specified at the start of file as either Engineering Strain or True Strain. If no metric is provided, then the data is assumed to be of a True Strain metric.
|
Margin line offset (%)
|
Absolute
|
The margin line is obtained by offsetting the FLC curve down by a constant value. The constant value is input as a percentage. This will result in the margin line approximately parallel to FLC curve.
|
|
Relative
|
The margin line is obtained by offsetting each point of the FLC curve down by a multiple of its value. The multiple is input as a percentage. This will result in the margin line diverging from FLC curve.
|
Uniaxial compression line
|
R Value
|
Uniaxial compression line is obtained from normal anisotropy of the material.
|
|
Use Angle
|
Set the angle of the uniaxial compression line with respect to the minor strain axis. 26.57 degrees is the default angle. This definition is always in a True Strain metric; HyperView will automatically convert them if the FLD Type is set to Engineering Strain.
|
Loose metal bound (%)
|
A semi-circle around the origin with 2% strain as the default radius. The percentage is always in a Engineering Strain metric; HyperView will automatically convert them if the FLD Type is set to True Strain.
|
Fit curve (FLC)
|
Creates a curve fit through the given set of points for the FLC corresponding to the File and Values methods.
|
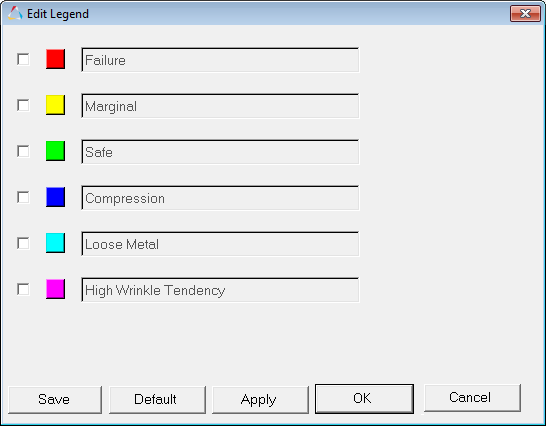
When you click Apply, the forming limit diagram plot is displayed showing the minor strain and major strains or stresses along the x and y axes (respectively) in the same plot as the forming limit curve. The FLD automatically plots the marginal FLC, the loose metal bound, and lines at ±45 degrees with respect to the major axis. The elements in the model in the main 3-D window change color to create a formability contour based on the corresponding colors in the FLC. The color scheme is:
Red
|
Failure (points above the FLC)
|
Yellow
|
Marginal (points between the FLC and safety curve)
|
Green
|
Safe (Points between ± 45 degree line and safety curve)
|
Blue
|
Compression (Points to the left of -45 degree line)
|
Light Blue
|
Loose metal (Points within a radius of 2% major or minor strain)
|
The 3-D window also displays a legend using the color distribution above.
The formability contours can be animated by clicking the start/pause transient animation icon,  . .
You can also mask simulation data so that only the FLD corresponding to the displayed component (part) of the FE model are displayed.

|
Select individual elements on the model, which are then highlighted on the forming limit diagram.
|

|
Opens the Coordinate Info panel where you can select curve points that will then be highlighted on the formability contour. It also allows you to click on the points in the FLD plot and highlight the corresponding elements on the formability contour.
|

|
Select element(s) on the model and trace their deformation path in the Forming Limit Diagram.
|
Edit Legend
|
Opens the Edit Legend dialog where you can change the legend properties.

FLD panel Edit Legend dialog
Click in the box next to a legend attribute in order to activate the color and text box for that attribute. To change the color, click on the color box and select a new color from the pop-up dialog. To rename a legend attribute, click inside the text box and type in a new name.
|
|
Save
|
Saves the current legend settings to a Tcl file, which can be used in preferences.
|
|
Default
|
Resets the default legend properties.
|
|
Apply
|
Apply the changes made to the legend.
|
|
OK
|
Apply the changes and exit the Edit Legend dialog.
|
|
Cancel
|
Click Cancel to disregard changes and exit the dialog.
|
|
How Do I....
| 1. | From the FLD panel, click Add under FLD Studies. A study is added to the list. The program sequentially names studies Study 1, Study 2, and so on, based on the number of studies already in the list. The study type is displayed next to the study name. |
| 3. | Under Source, select File, Math, or Values. |
| • | If you select File, click the file browser button  and select a file. and select a file. |
| • | If you select Math, enter values for n (strain hardening component) and t (material thickness). |
| • | If you select Values, click Add and enter XY values corresponding to the minor and major strains. |
| 4. | Click Apply. A HyperGraph window is added that displays the defined curve alongside the model. |
You can now create the forming limit diagram plot using the FLD tab.
| Note | Several curves can be created in the same session and turned on and off for display. |
|
| 1. | From the Load Model panel, load a simulation. |
| 3. | From the study list, select the study to be used for the current plot. |
| 5. | Using the Component input collector, select the components to be used for the FLD plot. |
| 6. | Select Strain as the result type. |
| 7. | Select an element layer from the drop-down menu next to the result type. |
| 8. | For Display, select Zone contour or Distance contour. |
| 9. | Activate the Shear line check box. |
| 10. | Select Use Angle and enter a value. |
OR
Select Use File and load a file.
| 11. | Activate the Margin line offset (%) check box and enter an Absolute or Relative percentage value. |
| 12. | Activate the Uniaxial compression line check box and enter an R Value or Use Angle value. |
| 13. | Activate the Loose metal bound (%) check box and enter a percentage value. |
| 14. | Click Apply. The forming limit diagram plot is displayed. |
| 15. | The 2-D window showing the FLD plot displays the chosen FLC curve. If you select a different curve, the plot can be updated to reflect that graph by clicking Apply. |
| 16. | Use Circle Zoom to zoom in on a set of points on the FLD plot. The points inside the zoom box fill the 2-D window. Click  to replot all the strain points. to replot all the strain points. |
|
| 1. | Load a simulation using the Load Model panel. |
| 2. | Display the blank components for which a Forming Limit Diagram (FLD) is to be plotted. |
| 3. | Define or load a forming limit curve (FLC). An FLC is displayed in a separate 2-D window for you to preview. For comparison purposes, you can create additional FLD studies on the same model using various FLC definitions. |
| 4. | Return to the FLD panel and create an FLD using a reference FLC. The following items are displayed: the FLC, the safety curve, ±45 degree lines, and the elemental major and minor strains for the selected components in an xy-plot. |
|
| 1. | Load a simulation from the Load Model panel. |
| 3. | From the study list, select the study to be used for the current plot. |
| 5. | Select the components to be used for the FLD plot. |
| 6. | For Result type, select Strain and the layer at which the FLD is being created. |
| 7. | For Display, select Distance contour. |
| 8. | Click Apply. The model window displays color contours based on the distances between each point corresponding to the element major and minor strain plotted on the FLD and the FLC. The positive distances correspond to points above and the negative ones below the FLC. |
The plot window colors the strain points based on their location with respect to the failure, marginal, safe, loose metal, or compression zones.
|
See Also:
List of Tcl/Tk poIFLDCtrl Class Commands
Using Scalable Fonts under Linux to Render Text


![]() on the Tools toolbar, or select FLD from the Tools menu.
on the Tools toolbar, or select FLD from the Tools menu.
