Lattice Optimization in OptiStruct is a two-phase process to create blended Solid and Lattice structures from concept to the detailed final design. The first phase performs a concept-level topology optimization to optimally partition solid, void, and intermediate space and create the lattice elements. The second phase optimizes the size of each lattice element to determine the final optimized structure. The completed model can then be manually reinterpreted to fit a number of different manufacturing operations, including, but not limited to, 3D printing.
| Note: | Running Lattice Optimization requires HyperWorks version 13.0.210 or later. |
In this tutorial, you will learn to:
| • | Set up a basic lattice concept-level (Phase I) optimization using the DTPL card |
| • | Set up and review the basic options associated with lattice optimization |
| • | Set up a basic lattice fine-tuning (Phase II) optimization and review the results |
Problem Statement
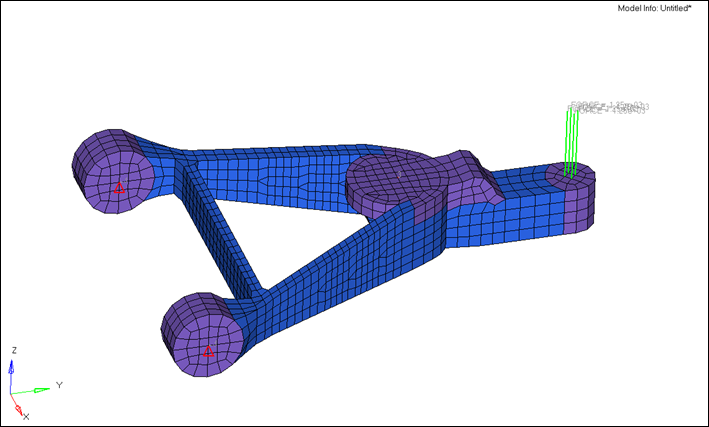
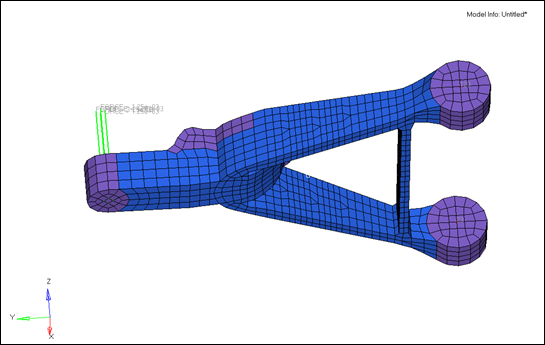
| • | Geometry: Control Arm, sectioned into non-design and designable components |
| • | Load cases: 1: Vertical load (Z-) on the control arm end |
Phase I: Concept Level Design
In the model, the non-design regions surround the load-bearing points and without the design space, the non-design area is discontinuous. This allows the optimization to determine the most efficient structure to transition the load and stress throughout the structure.
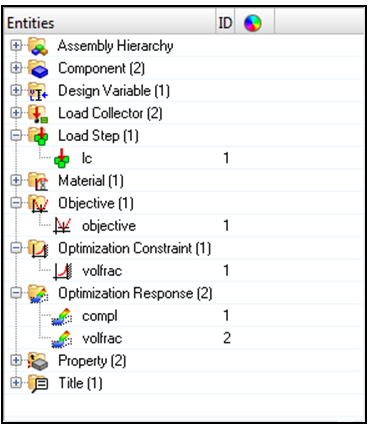
The Model browser shows that there is already an optimization set up.
Objective:
|
Minimize compliance
|
Constraints:
|
Volume Fraction (0.3)
|
Design spaces:
|
“design” PSOLID (5) and Stress constraint (200)
|
Responses:
|
Compliance and Volume Fraction
|
Lattice optimization differs from topology as a concept-level optimization in that elements with intermediate densities will be mathematically interpreted as solid, lattice, or void, depending on your settings in the setup phase. You will add continuation cards and parameters in a text editor to change this from standard topology to lattice optimization.
Step 1: Import the model controlarm.fem into HyperMesh Desktop
| 1. | Launch HyperMesh Desktop. |
| 2. | Select OptiStruct in the User Profiles dialog and click OK. This loads the user profile. |
User Profiles can also be accessed from the Preferences menu on the toolbar.
| 3. | Click the Import Solver Deck icon  . . |
| 4. | The File type: is OptiStruct. |
| 5. | Click the open file icon  in the File: field. A Select OptiStruct file browser window opens. in the File: field. A Select OptiStruct file browser window opens. |
| 6. | Select the controlarm.fem file you saved to your working directory from the optistruct.zip file. Refer to Accessing the Model Files. |
| 7. | Click Open. The location of controlarm.fem displays in the File: field. |
Step 2: Add the LATTICE continuation card to the DTPL card
| 1. | Close HyperMesh Desktop and open controlarm.fem in a text editor. |
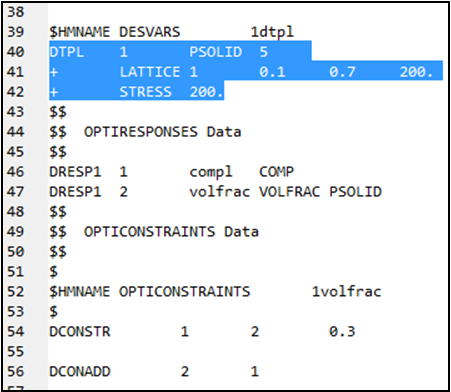
| 2. | Locate the optimization data in the deck. The DTPL card contains the data on the design space. |
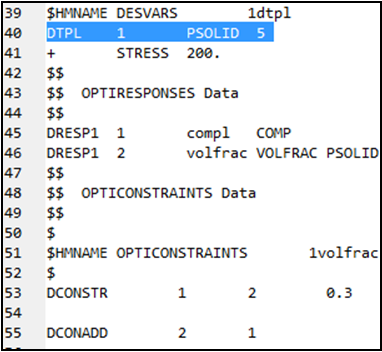
| 3. | Below the DTPL line, add the following line: |
+ LATTICE 1 0.1 0.7 200.
Each field begins with the field’s data and is padded with spaces to a total of 8 characters long.
+: A continuation of the preceding line/card, DTPL
LATTICE: This optimization should use lattice (porous) topology parameters.
1: Sets the lattice type (LT) according to the solid element type that it is replacing. 1 is the default or enter 2 as an option.
Element Types:
CHEXA: By default, this generates pyramidal lattices with quadrilateral bases and triangular internal adjoining faces. For option 2, it creates a tetrahedral matrix to replace the CHEXA element.
CPENTA: This creates a pair of lattices, one pyramidal, one tetrahedral regardless of setting (1 or 2).
CPYRA: This creates a pyramidal lattice regardless of setting (1 or 2).
CTETRA: This creates a tetrahedral lattice regardless of setting (1 or 2).
0.1: The lower bound (LB) for lattice structure. Any elements with a topology density below this value is considered void (empty) at the end of Phase I.
0.7: The upper bound (UB) for lattice structure. Anything above this element density in the optimization is considered fully solid. Elements where element density is between the lower and upper bound are considered porous and is replaced by lattice elements at the end of Phase I.
200.: Sets a stress constraint target for optimization for the second phase of lattice optimization (LATSTR). That means for Phase II, OptiStruct will automatically create a stress constraint (refer to Lattice Structure Optimization in the User's Guide). The stress target for Phase I (via the STRESS continuation card which was already present in this deck and set to 200), is not automatically ‘copied’ to Phase II.
|
| 4. | Save the controlarm.fem text file. |
Step 3: Add the optimization parameters DOPTPRM to control the optimization
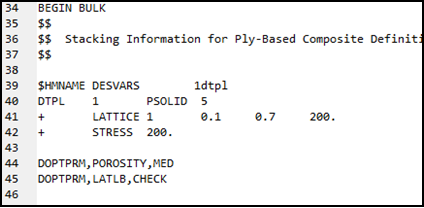
| 1. | Below the final stress continuation card for the DTPL entry, add the following two lines: |
DOPTPRM,POROSITY,MED
DOPTPRM,LATLB,CHECK
DOPTPRM indicates that optimization parameters to control the optimization are being added.
DOPTPRM, POROSITY determines the penalty factor applied to all designable elements throughout the optimization. In regular topology optimization, a penalty is applied to avoid medium dense elements by significantly reducing their stiffness. In Lattice optimization, medium dense elements can be accepted as they can be manufactured as a lattice structure. You can apply a smaller penalty or nothing, which controls the number of medium dense elements and consequently lattice type elements. This parameter has three options:
LOW: Sets the penalty factor to 1.8. This setting accurately represents the structural relationship between intermediate dense solid elements and lattice type elements, which result in a model that has few lattice elements, as medium dense elements are widely removed, due to the penalty.
MED: Sets the penalty factor to 1.25. This penalizes intermediate dense elements to some extent and results in a moderate presence of lattice zones.
HIGH: Sets the penalty factor to 1, negating any penalty to the Young’s Modulus and density relationship. This usually leads to a high number of lattice elements, but also produces a mathematical over-estimation of stiffness for structures known to be porous, which leads to a larger discrepancy between the structural performance of Phases I and II.
In some cases a certain value for LB can lead to important parts of the structure being interpreted as void. For instance, for a high number, such as 0.5 or where important parts of the structure have low densities. In those cases, the removal of the void elements can lead to a non-functioning structure. DOPTPRM, LATLB aims at preventing such scenarios. It will force OptiStruct to check the structure for large differences in compliance between the final iteration of Phase I and the one where the elements with density below LB are removed. If the structure is found to be too ‘soft’, the lower bound for lattice zones can be adjusted downward during the optimization to create a more continuous or stiff structure that more closely represents the original mesh. This parameter has the following options:
CHECK: Requests that OptiStruct check the lattice optimized representation of the model for differences in compliance.
AUTO: Allows OptiStruct to automatically adjust the lower bound of the lattice-optimized model downward to increase the model continuity.
NONE: No check for performance loss is made.
| 2. | Click File > Save to save the controlarm.fem text file. |
Step 4: Run the optimization
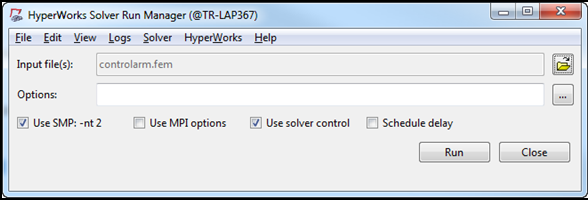
| 1. | Open the HyperWorks Solver Run Manager and browse for the controlarm.fem file. |
| 2. | Click Run to run the optimization. |
| 3. | When the optimization has completed, open the controlarm.out file in a text editor, to check how the optimization progressed. Make sure that the optimization is fully converged and that the constraint is satisfied. |
OptiStruct provides a summary of the lattice optimization and its effects on the model, at the end of the output file.
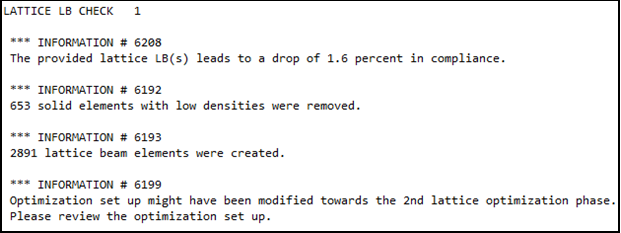
Since DOPTPRM, LATLB, CHECK was applied, OptiStruct checked the drop-in compliance, due to the removal of elements with density below LB. The drop is relatively small and this LB can be considered a good choice.
Phase II: Fine-Tuning Design
Step 1: Open the model controlarm_lattice.fem in a text editor
At the end of Phase I, OptiStruct automatically created a new file, controlarm_lattice.fem, from your original optimization model. In this model, the original designable elements with a density below LB have been removed, those above UP remain unchanged and those in-between are replaced by bars (CBAR) representing the lattice structure.
The second phase of this optimization will optimize the radius of each joint in the lattice structure to determine where there is a need for material. The necessary design variables (DESVAR) and design variable property relationships (DVPREL1), along with the stress constraints are automatically created. In many cases, the model can be run as is, but it is advised to always review the optimization setup.
Step 2: Review the model to verify the changes to the original model
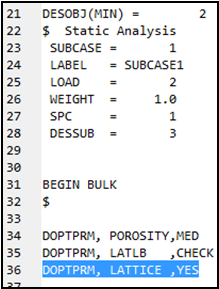
| 1. | The beginning of the deck shows that the new file has retained your original objective, but added a new optimization parameter indicating that this size optimization is Phase II of a lattice structure optimization. |
| 2. | OptiStruct has inserted the CBAR elements, which represent the new lattice material, below the GRID cards, which provides details about the model nodes. |

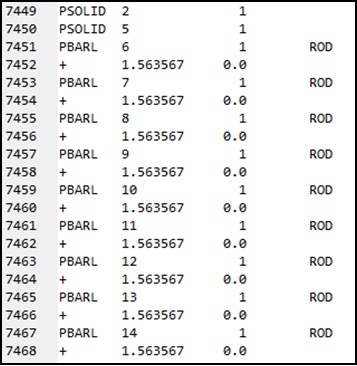
| 3. | Each CBAR element has its own PBAR property definition, listed later in the deck, which indicates each element can be individually optimized. |
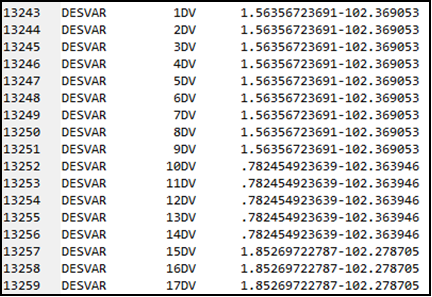
| 4. | Each joint between multiple CBAR elements has a design variable created for it. |
| 5. | At the end of the file are the design variable property relationships (DVPREL1), which relate properties to their associated design variable for the size optimization in the second phase. These are followed by the responses, the constraints, and the objective. |
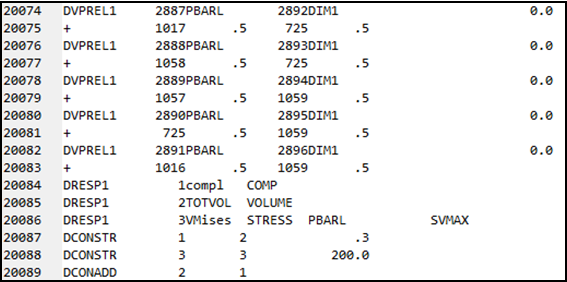
Note: The volume fraction response in the original model has been replaced by total volume in the size optimization phase, which will now be minimized and a new response has been added to constrain the von Mises stress in the lattice region to 200. This was created from the value in the last field of the LATTICE continuation card in the first phase.
Step 3: Run the second optimization phase
| 1. | Close the controlarm_lattice.fem file in the text editor. |
| 2. | Load the controlarm_lattice.fem file in the HyperWorks Solver Run Manager. |
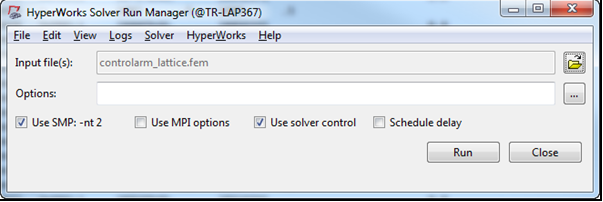
| 3. | Click Run to run the optimization. |
| 4. | Open the controlarm_lattice.out file in a text editor to review critical information about the optimization run. |
Verify that the optimization is fully converged and that the constraint is satisfied.

Note: The difference in lattice penalty (lower than 1.8, set by the optimization parameters) causes the compliance of the final Phase I model to differ from the initial Phase II model. This compliance difference is also affected by solid elements retained in the Phase II model, which recover their full density/stiffness. For this reason, post-processing a lattice optimization requires that you analyze changes to the model compliance between the Phase I final optimization compliance and the Phase II initial compliance calculation and again at the end of Phase II.
| 5. | Load the controlarm_lattice_optimized file in the HyperWorks Solver Run Manager. |
| 6. | Click Run for verification purposes. |
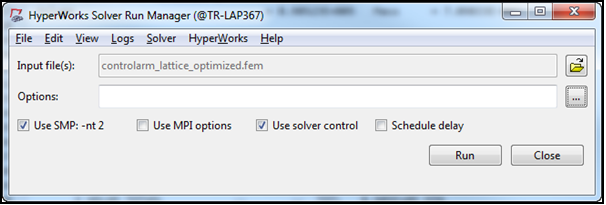
Since the optimization removes CBAR elements of small radius after the last optimization, the compliance for the last optimized run should be confirmed against the controlarm_lattice_optimized.fem file, an analysis of the optimized structure provided by OptiStruct.
| 7. | Compare the final compliance between the controlarm_lattice.out and controlarm_lattice_optimized.out files. |

Final compliance from the optimization run

Final compliance from the analysis model
Step 4: Post-process the results from the Phase II optimization
| 1. | Import the file controlarm_lattice_optimized.fem into a new HyperMesh Desktop session. |
| 2. | From the 1D Element Representation menu, select 1D Detailed Element Representation to show the CBAR elements in the model with their radii applied. |
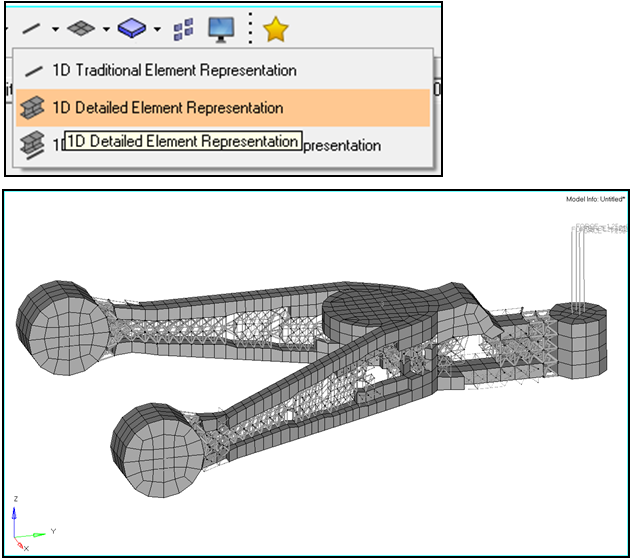
An overall view of the optimized solid/lattice model
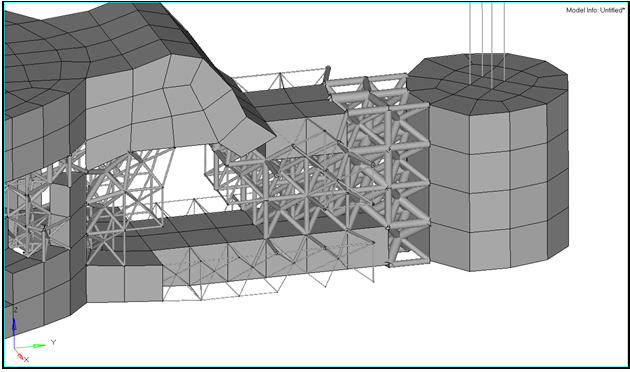
Detail of the front of the optimized lattice/solid model showing the variation in CBAR radius
| 3. | Load the file controlarm_lattice_s1.h3d into a new HyperView session. |
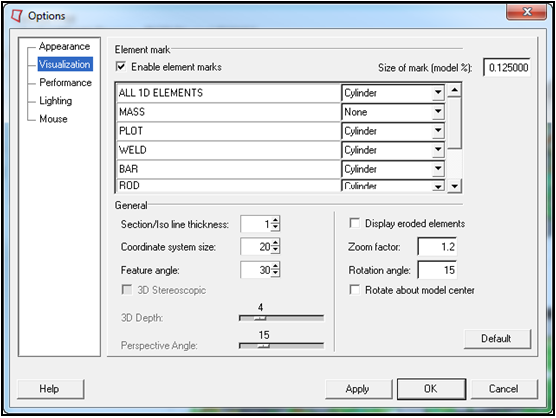
| 4. | From Preferences > Options, toggle Enable element marks and set the BAR representation to Cylinder, with a Size of mark (model %) set to 0.125. |
| 5. | Click Apply and OK to exit the options. |
| 6. | Using the Contour panel  , select CBAR/CBEAM Stresses (ROD) and set Subtype to NORMAL S1N(A). , select CBAR/CBEAM Stresses (ROD) and set Subtype to NORMAL S1N(A). |
| 7. | Click Apply to contour the beam element visualization. |
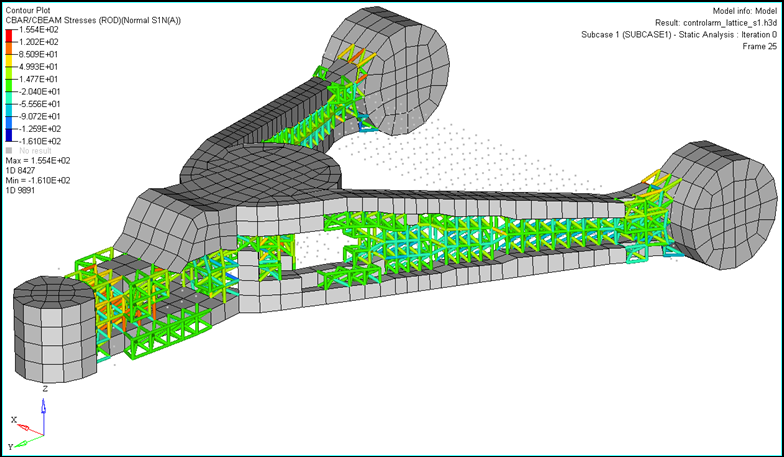
Iteration 0 (Initial Sizing Design)
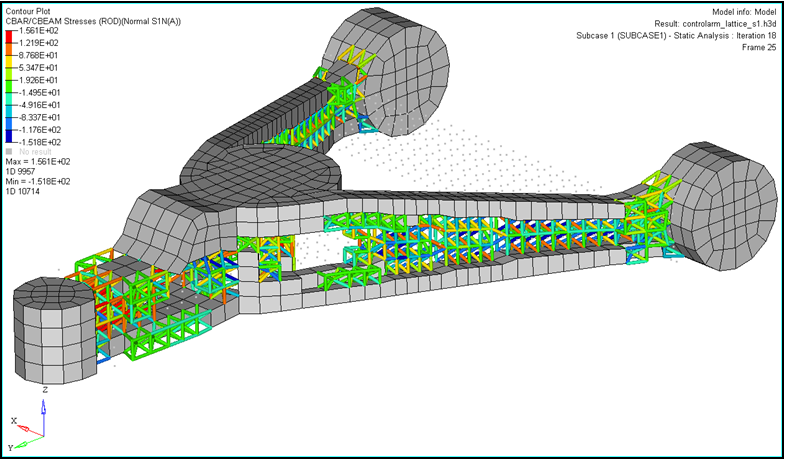
Last Iteration (Final Design)
See Also:
OptiStruct Tutorials


