Composite materials have become popular in the application of aircraft structures. The need for innovative designs has posed a great challenge. This tutorial discusses the optimization-driven design approach of a composite aircraft underbelly fairing using OptiStruct.
The design takes a three-phased approach:
Phase 1
|
Concept design synthesis
Free-size optimization identifies the optimal ply shapes and locations of patches per ply orientation.
|
Phase 2
|
Design fine tuning
Size optimization identifies the optimal thicknesses of each ply bundle.
|
Phase 3
|
Ply stacking sequence optimization
Shuffling optimization obtains an optimal stacking sequence.
|
The process expands upon three important and advanced optimization techniques; free-size optimization, size optimization and ply stacking sequence optimization. By stringing these three techniques together, OptiStruct offers a unique and comprehensive process for the design and optimization of composite laminates. The process is automated and integrated in HyperWorks by generating the input data for a subsequent phase automatically from the previous design phase.
Problem Definition
The finite element model of the underbelly fairing was generated in HyperMesh, as shown in the following image. Material properties for carbon-fiber were considered and represented using an orthotropic material (MAT8) for two dimensional elements. The fairing was modeled with four ply orientations (0°, 90°, 45° and -45°) of uniform thickness. The SMEAR option is applied in the PCOMP card to eliminate stack biasing.
Two load cases were defined to represent the operating conditions – an internal uniform pressure loading of 0.02MPa and an external gravity loading of 6.75g. The fairing was considered to be riveted along its edges to the surrounding structure. Two equipment masses, weighing 2Kg and 3Kg each, were mounted to the fairing through RBE3 elements. The fairing has been designed considering two major performance criteria: the first natural frequency is at least 20Hz, and the maximum strain is less than 1000 micro-strain.
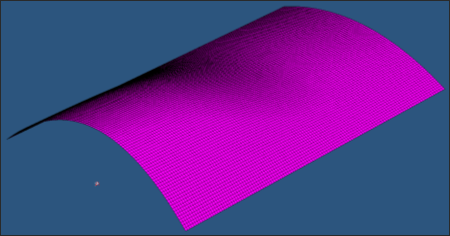
Model overview
Phase 1 – Concept Design Synthesis (free-size optimization)
In free-size optimization, the thickness of each designable element is defined as a design variable. Applying this concept to the design of composites implies that the design variables are the thickness of each ‘Super-ply’ (total designable thickness of a ply orientation) per element.
The following optimization setup is defined in the concept design phase to identify the stiffest design for the given fraction of the material. To obtain more meaningful results, manufacturing constraints are incorporated and carried through all design phases automatically.
Objective:
|
Minimize the weighted compliance of the two load cases.
|
Constraints:
|
Volume fraction < 0.3
|
Design variables:
|
Element thicknesses of each ply orientation.
|
Manufacturing constraints:
|
| • | Ply percentage for the 0s no more than 80% exist. |
| • | The manufacturable ply thickness is 0.1. |
| • | A balance constraint that ensures an equal thickness distribution for the +45s and -45s. |
|
Step 1: Load the OptiStruct user profile and import the model into HyperMesh
| 2. | Select OptiStruct in the User Profiles dialog and click OK. This loads the user profile. It includes the appropriate template, macro menu, and import reader, paring down the functionality of HyperMesh to what is relevant for generating models OptiStruct. |
User Profiles can also be accessed from the Preferences menu on the toolbar.
| 3. | Click the Import Solver Deck icon  . . |
| 4. | The File type: is OptiStruct. |
| 5. | Click the open file icon  in the File: field. A Select OptiStruct file browser window opens. in the File: field. A Select OptiStruct file browser window opens. |
| 6. | Select the fairing.fem file you saved to your working directory from the optistruct.zip file. Refer to Accessing the Model Files. |
| 7. | Click Open. The location of fairing.fem displays in the file: field. |
| 8. | Click Import. The fairing.fem database is loaded into the current HyperMesh session. |
Step 2: Create the design variables for free-size optimization
| 1. | From the Analysis page, enter the optimization panel. |
| 2. | Click free size to enter the free-size optimization panel. |
| 3. | On the create subpanel, type fairing in the desvar= field. |
| 4. | Click the switch under type and select PCOMP(G). |
| 5. | Click the highlighted props, select fairing_ply, and click select. |

Figure 1: Field entries for the free-size panel
| 6. | Verify that the fields in the create subpanel match the fields shown above and click create. |
The design variable fairing is created for the free-size optimization. The manufacturing constraints on ply percentage and ply balance will be defined next.
| 7. | Go to composites subpanel. Make sure fairing is selected as the design variable. |
| 8. | Click edit and enter the DSIZE panel to define the manufacturing constraints on ply percentage and ply balance. |
| 9. | Check the box in front of PLYPCT. |
| 10. | Set Ply Percentage Options to BYANG. |
| 11. | In the DSIZE_NUMBER_OF_PLYPCT = field, enter the value of 1. A PLYPCT continuation line is added to the DSIZE data entry. |
| 12. | Check the box in front of BALANCE. |
| 13. | In the field of DSIZE_NUMBER_OF_BALANCE=, enter the value of 1. A BALANCE continuation line is added to the DSIZE data entry. |
| 14. | Check the box in front of PLYMAN. A PLYMAN continuation line is added to the DSIZE data entry. |
| 15. | Define the PLYPCT, BALANCE and PLYMAN constraints, as shown below. |
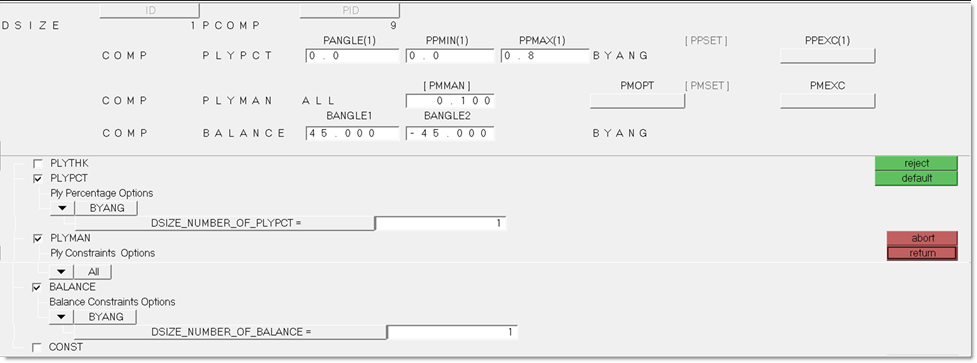
Figure 2: DSIZE data entry fields
| 16. | Click return to go back to the composites subpanel. |
| 18. | Click return and go back to the optimization panel. |
Step 3: Create the responses
| 2. | Enter wcomp in the response= field. |
| 3. | Set the response type: to weighted comp. |
| 4. | Click the highlighted loadsteps. |
| 5. | Select gravity and pressure loadcases, and make sure the factors are 1.0 for both loadcases. |
| 6. | Click return to go back to the response panel. |

Figure 3: Responses Panel (Weighted Compliance)
| 8. | Enter volfrac in the response= field. |
| 9. | Set the response type: to volumefrac. |
| 10. | Make sure the total is selected and the toggle is set to no regionid. |

Figure 4: Responses Panel (Volume Fraction)
| 12. | Click return to go back to the optimization panel. |
Step 4: Define constraints for optimization
| 1. | Select the dconstraints panel. |
| 2. | In the constraint= field, enter con_vol. |
| 3. | Click response= and select volfrac. |
| 4. | Activate upper bound= and input a value 0.3. |

Figure 5: Optimization Constraints Panel (Volume Fraction)
Step 5: Define the objective function
| 1. | Select the objective panel. |
| 2. | Select min as the optimization type. |
| 3. | Click response= and select wcomp. |

Figure 6: Optimization Objective Panel (Weighted Compliance)
| 5. | Click return twice to go back to the Analysis page. |
Step 6: Define the output request
The output control on composite strain and stress results are defined here. OUTPUT,FSTOSZ (free size to size) is used to output a ply-based input deck for size optimization.
| 1. | From the Analysis page, select control cards. |
| 2. | Click next and then click GLOBAL_OUTPUT_REQUEST. |
| 3. | Select CSTRAIN and CSTRESS and input the following (Figure 7) to output all composite strain and composite stress results for all elements to the H3D file. |

Figure 7: Requesting CSTRAIN and CSTRESS results output to the .h3d file
| 5. | Click next and click the OUTPUT card. |
| 6. | In the OUTPUT panel, enter 1 as the number_of_outputs. |
| 7. | Set FSTOSZ as the KEYWORD and YES for FREQ. |

Figure 8: Requesting the free-size to size (FSTOSZ) optimization output file for Phase 2.
OptiStruct automatically generates a sizing model after free-size optimization.
| 8. | Click return twice to go back to the Analysis page. |
Step 7: Submit the free-size optimization job
| 1. | From the Analysis page, select the OptiStruct panel. |
| 2. | Click save as following the input file: field. |
| 3. | Select the directory where you would like to write the OptiStruct model file and enter the name for the model, fairing_freesize.fem, in the File name: field. |
The name and location of the fairing_freesize.fem file displays in the input file: field.
| 5. | Toggle memory options: to memory default. |
| 6. | Toggle run options: to optimization. |
| 7. | Toggle export options: to all. |

Figure 9: OptiStruct Panel
| 8. | Click OptiStruct. This launches OptiStruct to run the job. |
If the job was completed successfully, new results files can be seen in the directory from which fairing_freesize.fem was saved.
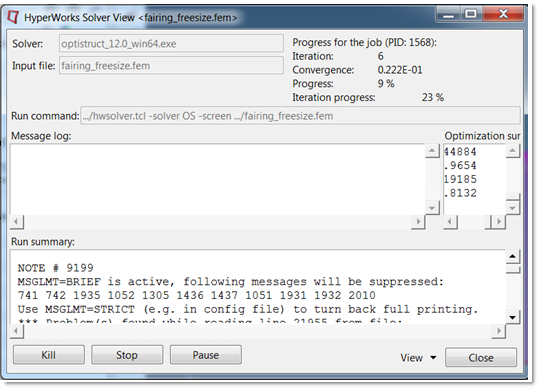
Figure 10: The HyperWorks Solver View window
A few default files written to your directory are:
fairing_freesize_s1(2).h3d
|
Hyper 3D binary results file, with the static analysis results of both subcases.
|
fairing_freesize_des.h3d
|
Hyper 3D binary results file, with free size optimization results.
|
fairing_freesize.out
|
An ASCII output file contains specific information on the model setup, compute time information, etc. Review this file for warnings and errors.
|
fairing_freesize_sizing.*.fem
|
A ply-based sizing optimization input file generated during free-sizing phase. This resulting deck contains PCOMPP, STACK, PLY, and SET cards describing the ply-based composite model, as well as DCOMP, DESVAR, and DVPREL cards defining the optimization data. The * sign represents the final iteration number.
|
fairing_freesize_sizing.*.inc
|
An ASCII include file contains the same ply-based modeling and optimization data as in the input deck. The * sign represents the final iteration number.
|
Step 8: View the element thickness results
| 1. | When the job is complete, click HyperView (from the OptiStruct panel). |
This launches HyperView and opens the session file fairing_freesize.mvw which contains three pages with the results from three H3D files (click Close in the Message Log window):
Page 1 – optimization results in fairing_freesize_des.h3d
Page 2 – analysis results of subcase 1 in fairing_freesize_s1.h3d
Page 3 – analysis results of subcase 2 in fairing_freesize_s2.h3d
| 2. | On Page 1, go to the Contour panel and select the plot options, as shown below. |

Figure 11: Contour panel plot options (free-size optimization results)
| 3. | Select the last iteration in the Load Case and Simulation Selection drop-down in the Results browser. |
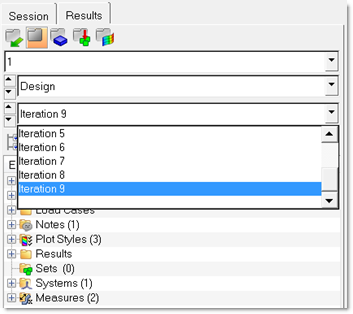
Figure 12: Selecting the final iteration
| 4. | Click Apply and then XY Top Plane View  to view the results in the X-Y plane. to view the results in the X-Y plane. |
The element thickness results from the free-size optimization are shown in the following image. The regions indicated in red or in colors tending towards red (from the legend) can be interpreted as thicker regions, while those in blue or tending towards blue are thinner regions. The contour plot indicated above is the total thickness distribution that includes contributions from each ply orientation, i.e. a thickness contribution from the 0s, +/-45s and the 90s. It also indicates the shape and layout of plies per orientation as can be seen in the ply thickness plot.
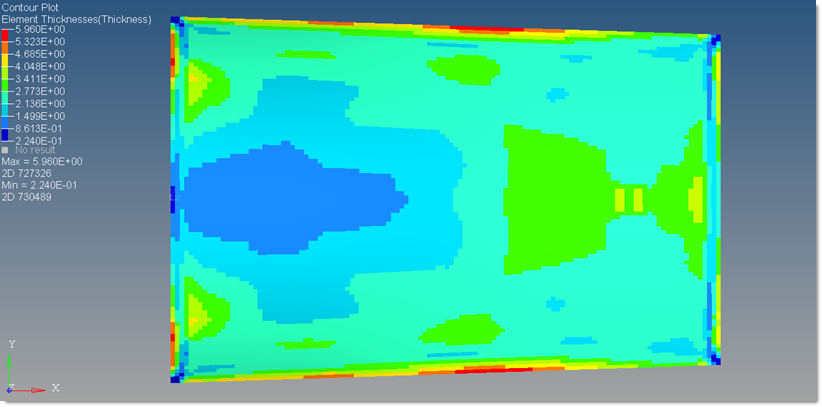
Figure 13: Element thicknesses contour plot after free-size optimization
Step 9: View the ply thickness results
| 1. | From the Contour panel, select Ply Thicknesses (s) as the Result type. The other plot options should be selected, as shown below. |

Figure 14: Ply Thicknesses contour plot
| 2. | Select the last iteration in Load Case and Simulation Selection drop-down (similar to Figure 12). |
The thickness distribution of 0 degree super ply is generated and shown in Figure 15. It represents the ply shapes and patch locations of the 0 degree ply bundles.
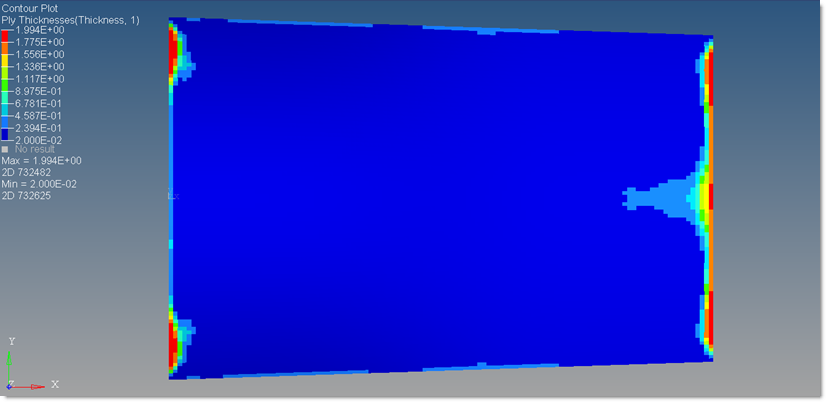
Figure 15: Ply Thickness Contour plot of the 0 degree super-ply
| 4. | Repeat step 1 through 3 to create the ply thickness contours for super-ply 2 (45°), 3 (-45°), and 4 (90°) by selecting Layers 2, 3 and 4, respectively in the Contour panel. |
| 5. | Figures 16 and 17 represent the ply shapes and patch locations of +/-45 and 90° ply bundles. Due to the balance constraint applied, the thickness distribution of the +45° and the -45° super ply are the same. |
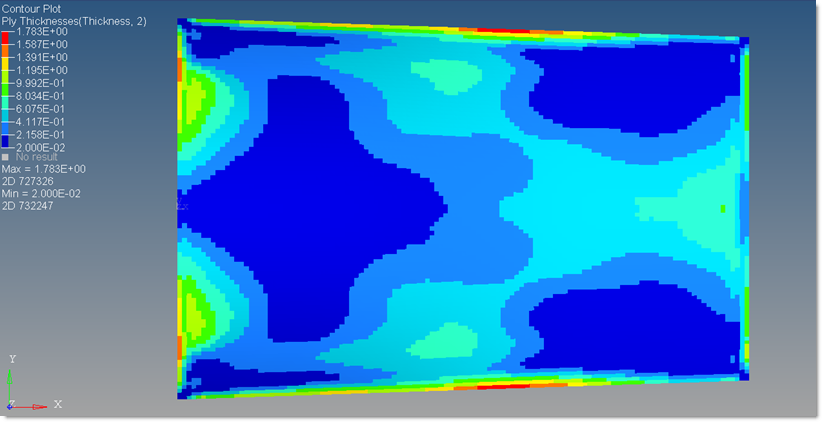
Figure 16: Ply Thickness Contour plot of the -45/+45 degree super-plies
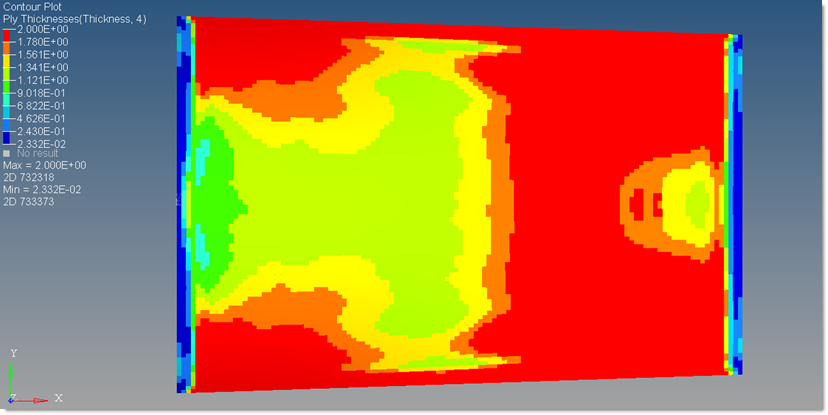
Figure 17: Ply Thickness Contour plot of the 90 degree super-ply
Step 10: View the ply bundles through element sets
The optimized ‘Super-ply’ thickness is subsequently represented as ‘Ply Bundles’. Four ply bundles per fiber orientation (Super ply) are output by default, based on an intelligent algorithm in OptiStruct. These ply bundles represent the shape and location of the plies per fiber orientation through element sets. In this case, a total of 16 ply bundles are created after free size optimization converges: element sets 1 through 4 represent the ply bundles for 0 degree super-ply; element sets 5 through 8 represent ply bundles for +45° super-ply; element sets 9 through 12 represent ply bundle -45° super-ply; element sets 13 through 16 represent ply bundles for 90° super-ply.
| 1. | Go back to the HyperMesh session. |
| 2. | Click the Import panel toolbar icon  . . |
| 3. | The File type: is OptiStruct. |
| 4. | Click the open file icon  in the File: field. in the File: field. |
| 5. | Select the fairing_freesize_sizing.*.inc file, located in the same directory where the file fairing_freesize.fem is saved. |
| 6. | Click Import to import the model into session. |
| 7. | Turn the display off for all the load collectors: go to the Model browser, right-click on LoadCollector and select Hide. |
| 8. | On the Analysis page, click entity sets. |
| 9. | Click review on the right side of the window and select set 5 which represents the ply bundle 1 of the +45° orientation super-ply (Figure 18). (The ply bundles can also be reviewed under Ply in the Model browser, right-click on any PLYS and click Edit). |
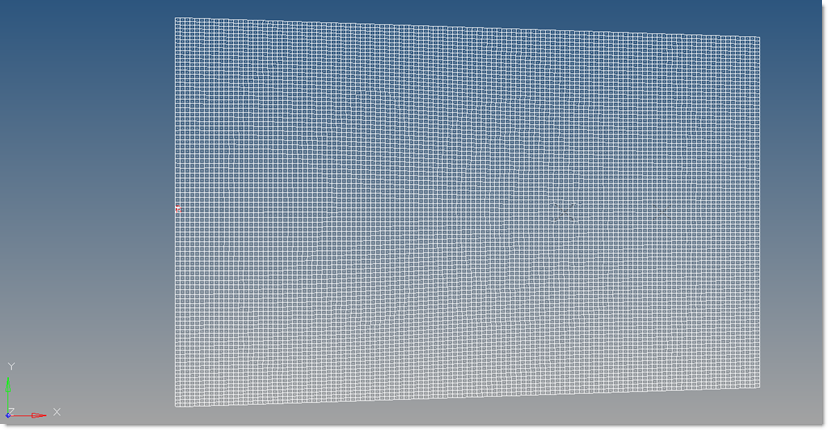
Figure 18: Element set 5 representing ply bundle 1 of the +45 degree super ply
| 10. | Repeat step 10.9 to review the element sets 6 though 8 (Figures 19 through 21). |
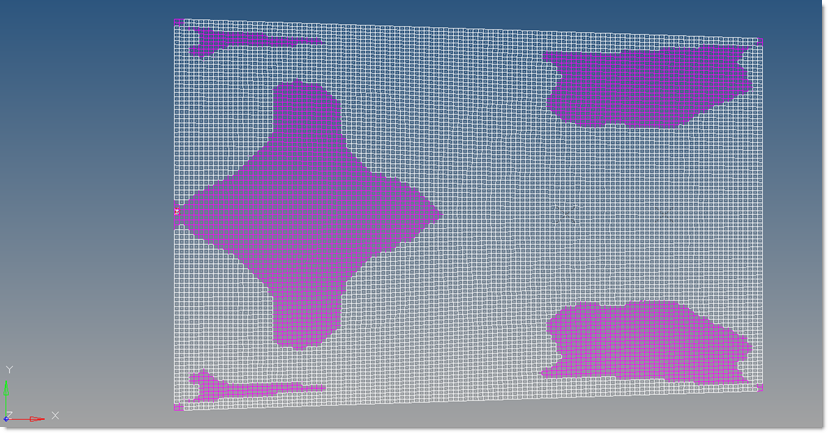
Figure 19: Element set 6 representing ply bundle 2 of the +45 degree super ply
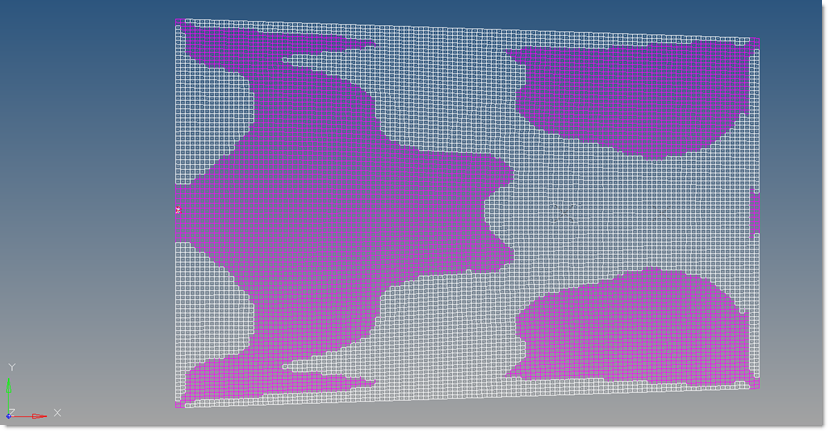
Figure 20: Element set 7 representing ply bundle 3 of the +45 degree super ply
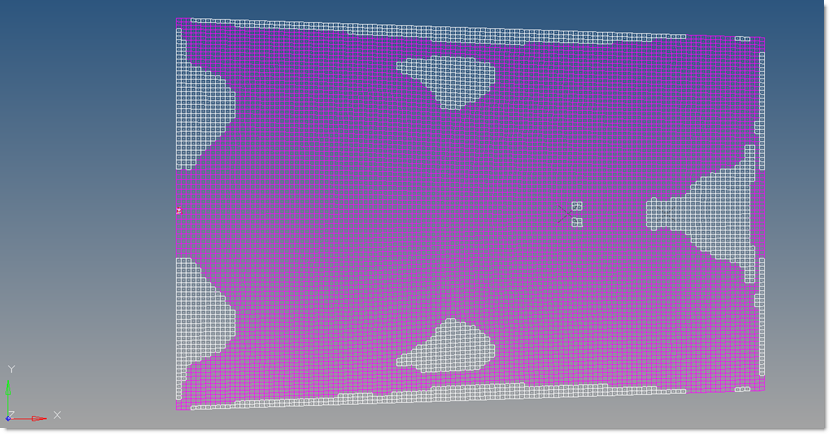
Figure 21: Element set 8 representing ply bundle 4 of the +45 degree super ply
The shapes of the plies as indicated through the element set can be used as-is in design Phase 2, or modified easily by updating the element sets in HyperMesh to improve the manufacturability. In this case, the element sets are used as-is.
Phase 2 – Design Fine Tuning (size optimization)
In the second design phase, a size optimization is performed to fine tune the thicknesses of the optimized ply bundles from Phase 1. To ensure that the optimization design meets the design requirements, additional performance criteria on natural frequencies and composite strains are incorporated into the problem formulation. A normal modes analysis load case is added to calculate the natural frequencies of the fairing under assembled conditions. The optimization setup is also modified to factor in these additional performance targets, among others.
The following is the modified optimization setup:
Design variables:
|
Ply thicknesses, which have been defined in the size input deck from Phase 1
|
Objective:
|
Minimize the total designable volume
|
Constraints:
|
| • | Natural frequencies (1st ~ 5th) > 0.02 KHz |
| • | Composite strains in the fairing < 1000 micro-strain |
|
Manufacturing constraints are preserved and transferred to the DCOMP card. A minimum manufacturable ply thickness of 0.1, defined in Phase 1, is transferred to the PLY card. It allows for the optimal ply bundle thicknesses to be a multiple of the minimum ply thickness value, and helps in calculating the total number of plies required per fiber orientation.
Step 1: Load the OptiStruct user profile and import the model
Follow Step 1 in the free-size phase (Phase 1) to load the fairing_freesize.*.fem file into HyperMesh.
Step 2: Review the design variables for size optimization
The size design variables were generated automatically at the free-size stage. They can be reviewed in the size panel within the optimization panel.

Figure 22: Reviewing the automatically created Size design variables
Step 3: Review the manufacturing constraints
The manufacturing constraints were carried over to the size optimization phase automatically. They can be reviewed in the composite size panel in HyperMesh.
| 1. | From the optimization panel, click composite size. |
| 2. | Go to the parameters subpanel, click dcomp=, and select DCOMP9. |
| 3. | Click edit and review the DCOMP card image, as shown below. PLYPCT and BALANCE constraints (from DSIZE) are transferred to the DCOMP card. The manufacturable ply thickness constraint 0.1 in the PLYMAN continuation line (from DSIZE) is transferred to the PLY card. |

Figure 23: DCOMP entry
| 4. | Return to the parameters subpanel, and click update. |
Step 4: Delete the responses defined in the free-size phase
The optimization will be re-formulated to satisfy the main design requirements. The responses of weighted compliance and volume fraction used in the free-size phase will be removed.
| 1. | Go to the Delete panel by clicking  on the toolbar. on the toolbar. |
| 2. | Click the switch and select optiresponses. |
| 3. | Click the highlighted optiresponses and select wcomp and volfrac. |
The responses defined in free-sizing phase are deleted. The constraint and objective function defined based on them are automatically removed.
Step 5: Set up the normal modes analysis
Add a normal modes analysis to calculate the natural frequencies.
| 1. | In the Model browser, right-click and select Create > Load Collector. |
| 2. | In the Entity Editor, enter eigrl in the Name field. |
| 3. | Click Color and select any color. |
| 4. | For Card Image, select EIGRL from the list. |
| 5. | Click ND and enter 8 to request the first 8 modes (Figure 24). |
| 6. | In the Model browser, right-click and select Create > Load Step. |
| 7. | For Name, enter norm_modes. |
| 8. | Click Color and select a color from the color palette. |
| 9. | Click Analysis type and select normal modes from the drop-down menu. |
| 10. | For SPC, click Unspecified > Loadcol. |
| 11. | In the Select Loadcol dialog, select spc from the list of load collectors and click OK. |
| 12. | For METHOD(STRUCT), click Unspecified > Loadcol. |
| 13. | In the Select Loadcol dialog, select eigrl from the list of load collectors and click OK. |
Step 6: Create the responses for size optimization
The responses of volume, natural frequency, and composite strain are created for size optimization.
| 1. | Click optimization and then click responses. |
| 2. | For the response = field, enter volume. |
| 3. | Set the response type to volume. |
| 4. | Make sure the total volume is defined and the toggle is set to no regionid. |

Figure 24: Defining the Volume response
| 6. | For the response = field, enter freq1. |
| 7. | Set frequency as the response type. |
| 8. | In the Mode Number field, enter 1 to create the frequency response for the first mode and make sure that the toggle is set to no regionid. |

Figure 25: Defining the Frequency response
| 10. | Repeat step 6.6 through 6.9 to create frequency responses for mode 2, 3, 4, and 5. |
| 11. | For response =, enter cstrain. |
| 12. | Select composite strain as the response type. |
| 13. | Toggle the selection option to plies. |
| 14. | Click the highlighted plies and select all plies. |
| 15. | Select maj. Principal as the strain type. |
The cstrain response should be set, as shown below.

Figure 26: Defining the composite strain response
| 17. | Click return to go back to optimization panel. |
Step 7: Create optimization constraints
The responses of frequency and composite strain are defined as the optimization constraints.
| 1. | From the optimization panel, click dconstraint. |
| 2. | For constraint =, enter freq1. |
| 3. | Click response= and select freq1. |
| 4. | Activate the lower bound and enter 0.02. |
| 5. | Click the highlighted loadsteps and select the loadcase norm_modes. |

Figure 27: Defining the Frequency optimization constraint
| 7. | Repeat steps 7.2 through 7.6 to create constraints freq2, freq3, freq4, and freq5 respectively with the same lower bound of 0.02. |
| 8. | For constraint=, enter cstrain. |
| 9. | Click response= and select cstrain. |
| 10. | Activate the upper bound= and enter 0.001. |
| 11. | Click loadsteps and select loadcases gravity and pressure. |

Figure 28: Defining the composite strain optimization constraint
| 13. | Click return to go back to the optimization panel. |
Step 8: Create objective function for the optimization
| 2. | Select min as the optimization type. |
| 3. | Click response= and select volume. |

Figure 29: Defining Volume as the optimization objective
| 5. | Click return twice to go back to the Analysis page. |
Step 9: Define the output request for shuffling deck
The output control on composite strain and stress results defined in the previous phase are carried over automatically. OUTPUT,SZTOSH (sizing to shuffling) writes a ply stacking optimization input deck.
| 1. | From the Analysis page, select control cards. |
| 2. | Go to the OUTPUT panel. |
| 3. | Set SZTOSH as the KEYWORD and YES for FREQ. |
| 4. | Enter 1 as the number_of_outputs. |

Figure 30: Output request to automatically generate a shuffling deck
| 5. | Click return twice to go back to the Analysis page. |
Step 10: Submit the size optimization job
| 1. | From the Analysis page, click OptiStruct. |
| 2. | Follow the instructions in Step 7.7 from the free-size phase (Phase 1) to save the input file as fairing_size.fem and set up the run/memory options. |

Figure 31: Saving the phase 2 input file
| 3. | Click OptiStruct to launch OptiStruct to run the optimization. |
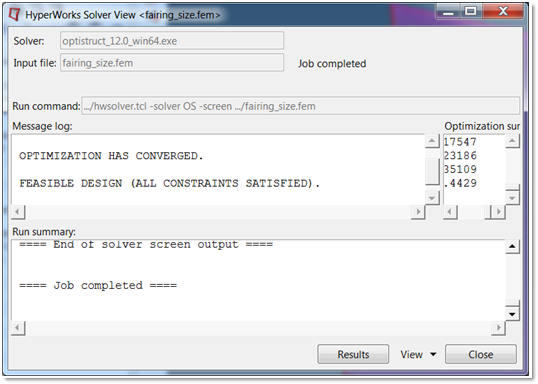
Figure 32: HyperWorks Solver View window to show the progress of the optimization
If the job was completed successfully, new results files can be seen in the same directory where fairing_size.fem was saved.
A few default files are:
fairing_size_s1(s2)(s3).h3d
|
Hyper 3D binary results file, with the analysis results of each subcase.
|
fairing_size_des.h3d
|
Hyper 3D binary results file, with size optimization results.
|
fairing_size.out
|
An ASCII output file containing specific information on the model setup, compute time information, etc. Review this file for warnings and errors.
|
fairing_size_shuffling.*.fem
|
A ply stacking optimization input deck. The DESVAR and DVPREL cards from the previous stage are removed, and a bare DSHUFFLE card is introduced. The * sign represents the final iteration number.
|
fairing_size_shuffling.*.inc
|
An ASCII include file containing ply stacking optimization data.
|
Step 11: View the thickness results in HyperView
| 2. | Follow the instructions in Step 8 from Phase 1 to create the element thickness contour, as shown below. |
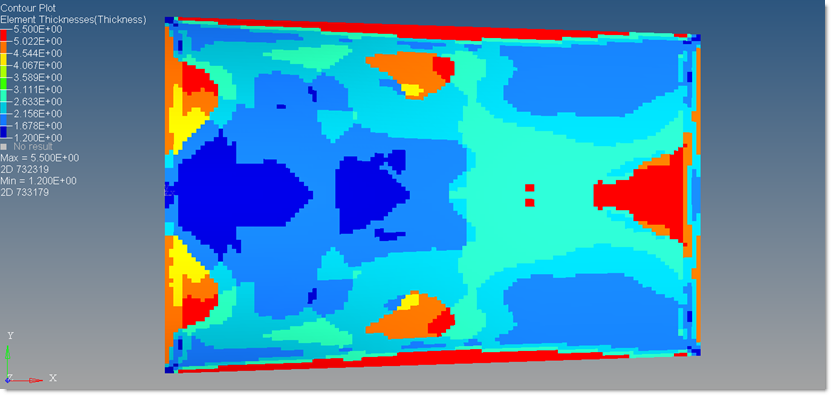
Figure 33: Element thickness contour plot (final iteration) after phase-2 size optimization
| 3. | Set the Result type to Orientation Thicknesses (s) to create the thickness contour for each ply orientation. |
| 4. | Set the Result type to Ply Thicknesses (s) to create the thickness contour for each ply bundle. |
After the free-size and size optimizations, a weight reduction of ~65% of the original design was achieved without violating any of the prescribed design constraints. The optimum ply shape and patch locations in Phase 1, and subsequently optimized ply bundle thicknesses in Phase 2, have been established, and allow us to determine the required number of plies. This brings us to the third and final phase of the design process in which you try to identify a proposal for the optimal stacking sequence of the plies.
Phase 3 – Ply Stacking Sequence Optimization
This algorithm is aimed at providing a global view of what the optimal stacking sequence could be. An input deck for the ply stacking sequence optimization, fairing_size_shuffling.*.fem, was generated from a previous design stage. Each ply bundle is divided into multiple PLYs whose thickness is equal to the manufacturable thickness (0.1 in this case), and the STACK card is updated accordingly. In this design phase, composite plies are shuffled to determine the optimal stacking sequence.
It is important that design performances are preserved. Hence, the optimization problem is retained as previously formulated in the size optimization phase. Two manufacturing constraints are applied:
| • | The maximum successive number of plies of a particular orientation does not exceed 4 plies. |
| • | The + 45s and – 45s are reversed paired. |
Step 1: Load the OptiStruct user profile and import the model
Follow Step 1 from the free-size phase to load the fairing_size_shuffling.*.fem file in HyperMesh.
Step 2: Update the composite strain response
Since the ply bundles were divided into multiple plies in the shuffling model, the ply information in CSTRAIN response needs to be updated, as well.
| 1. | Go to the optimization panel. |
| 3. | Click response= and select cstrain. |
| 4. | Click the highlighted plies and select all of the plies. |
| 5. | Click select and go back to the responses panel. |

Figure 34: Updating the CSTRAIN response
Step 3: Create the manufacturing constraints for shuffling
A DSHUFFLE card was created automatically during the sizing phase. Two manufacturing constraints will be added for the shuffling optimization.
| 1. | From the optimization panel, click composite shuffle. |
| 2. | Go to the create subpanel. |
| 3. | Click dshuffle= and select DSHUFFLE1. |
Review the type and stack ID.
| 5. | Click dshuffle = and select DSHUFFLE1. |
| 6. | Check the small box in front of pairing constraint. |
| 7. | Select reverse as the pair type and make sure that ply angles1 and ply angles2 are 45.0 and -45.0, respectively. |
| 10. | Define the MAXSUCC constraint, as shown below. |

Figure 35: Defining the MAXSUCC constraint
| 13. | Click return twice to go back to the Analysis page. |
Step 4: Submit the shuffling job
| 1. | On the Analysis page, click OptiStruct. |
| 2. | Follow the instructions in Step 7.7 in free-size phase (Phase 1) to save the input file as fairing_shuffling.fem and set up the run/memory options. |
| 3. | Click OptiStruct to launch OptiStruct to run the optimization. |
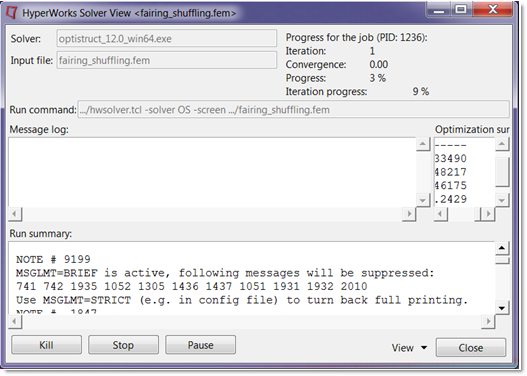
Figure 36: HyperWorks Solver View Window showing the progress of shuffling optimization
If the job was completed successfully, new results files can be seen in the same directory where fairing_shuffling.fem was saved.
The following result files are generated:
fairing_shuffling.prop
|
A property file contains the composite materials and ply properties at the last iteration.
|
fairing_shuffling.shuf.html
|
An html file contains the history of the shuffling optimization and the view of the ply stacking sequence.
|
Step 5: Post-process the results
| 1. | Go to the directory where fairing_shuffling.shuf.html is located and double-click the file. |
It is automatically loaded in your default Internet browser window, as shown in Figure 37.
The plies are color coded based on their fiber orientations.
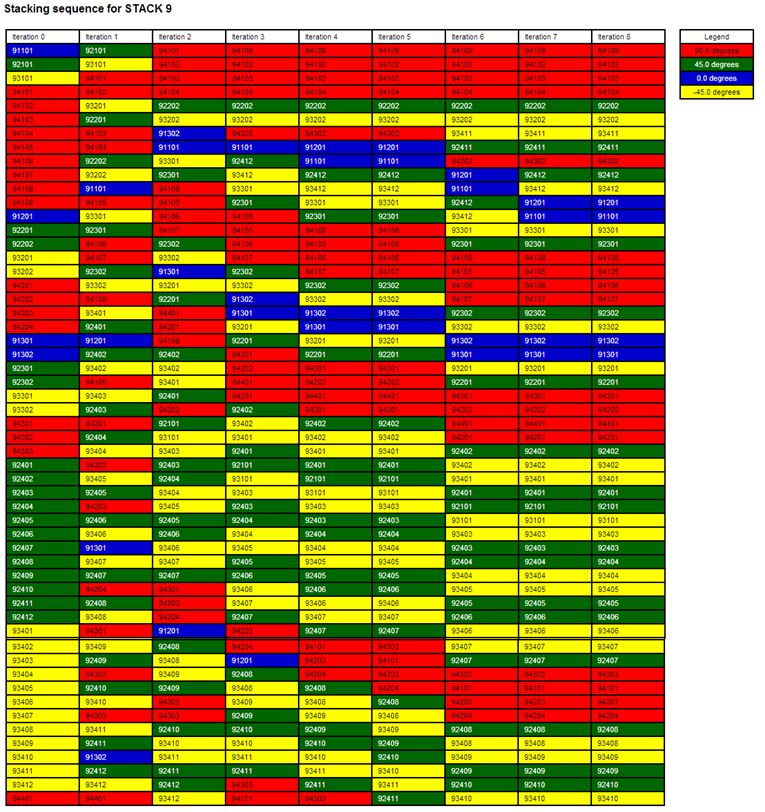
Figure 37: Shuffling Optimization History
The above image shows the history of the shuffling optimization. The columns represent the global trend of the ply stacking sequence at a particular iteration, with the last column being the final solution.
The weight of the fairing has not been changed during the shuffling design phase. Reviewing the results from this process:
| • | Lowest natural frequency = 0.02 KHz (>0.02 KHz) |
| • | Maximum strain = 9.947e-4 (<1.e-3) |
This light weight design therefore meets all of the performance requirements, is feasible and manufacturable.
See Also:
OptiStruct Tutorials


