The System Performance Data file, *.spd, contains the test data used for fitting a bushing. This data should be validated to ensure that it is physically meaningful. One test for physical consistency is that the dynamic stiffness at any amplitude of vibration must always be greater than the static stiffness at the same amplitude. Further information about how to perform such validations in the Model Identification Tool is included in the following sections:
The following figure shows a section of the dynamic data block in an .spd file. The contents of each column are described in the header line, shown in blue.
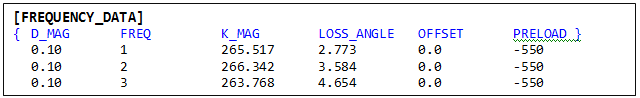
Note the following:
| • | Each line specifies an individual test that was performed. |
| • | The first column (D_MAG) of each line of data specifies the magnitude of the sinusoidal input. |
| • | The third column (K_MAG) specifies the dynamic stiffness that was measured in the test. |
| • | The sixth column (PRELOAD) specifies the preload that was applied to the bushing before the dynamic testing was done. In the example shown, a preload of -550 N was applied to deform the bushing. Subsequently, a dynamic test was performed. |
|
The figure below shows a section of the static data block. The contents of each column are described in the header line, shown in blue.
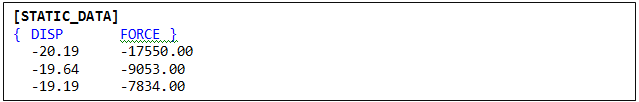
Note the following:
| • | The first column (DISP) of each line of data specifies the static displacement provided as input. |
| • | The second column (FORCE) specifies the static force that was measured for that input. |
|
Let the static data be represented with:
| • | N displacement data points xi, i=1…N. |
| • | N force data points, Fi, at displacements xi. |
An AKIMA spline is used fit this curve. Symbolically, this can be represented as:
| • | F (x) =AKIMA (x, xi, Fi) |
| • | x is the displacement at which the force F(x) is required. |
|
| A. | The first step is to compute the static deflection due to preload. |
| • | Designate the applied preload as P (for our example, P=-550 N). |
| • | Solve the nonlinear problem: P = AKIMA (x0, xi, Fi) and compute the required displacement x0. |
| B. | Compute the minimum and maximum values of the dynamic oscillation for each test, j, with an amplitude uj. |
| • | Maximum deformation, djmax = x0 + uj |
| • | Minimum deformation, djmin = x0 - uj |
| C. | Compute the average static stiffness for the range of dynamic oscillation in test j. |
| • | Fjmax = AKIMA (djmax, xi, Fi) |
| • | Fjmin = AKIMA (djmin, xi, Fi) |
| • | Kjsatic = (Fjmax - Fjmin) / (2* uj) |
|
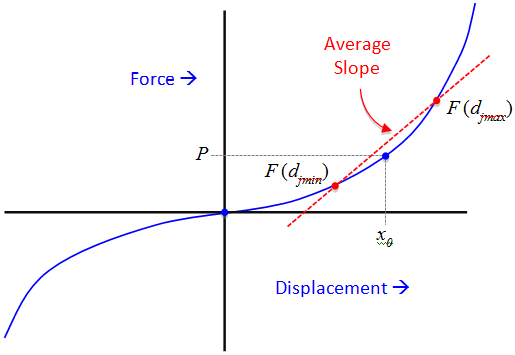
The validation test is shown in the following plot. The test essentially consists of verifying that the average slope of the static curve in the range of operation does not exceed the dynamic stiffness measured in the test.
The algorithm for performing the validation is as follows:
for each dynamic test j = 1...M
get displacement magnitude, uj (first column of dynamic data)
get dynamic stiffness, Kjmag (third column of dynamic data)
get preload, Pj (sixth column of dynamic data)
compute xo using algorithm (A)
compute range of dynamic oscillations using algorithm (B)
compute average stiffness for the range using algorithm (C)
if Kjsatic > Kjmag
issue warning message
|


