Menu Order
|
Options
|
First Menu
|
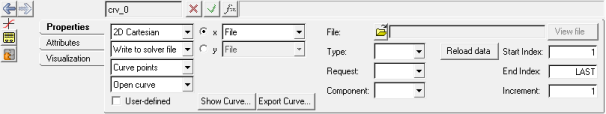
Select 2D/3D Cartesian or 2D/3D Parametric.
|
|
2D Cartesian
3D Cartesian
2D Parametric
3D Parametric
|
Determines if the curve is two dimensional or three dimensional.
Determines if the curve is described by xy (xyz) or uxy (uxyz) data.
|
|
|
Second Menu
|
Select File, Math, or Values as the data source for the curve. After you select the data source type, select the x and y radio buttons to define the x and y vectors of the curve.
|
|
File
|
Select data files for the x and y vectors. After selecting the data files, define the Type, Request and Component options for each vector.
|
|
|
File
|
Click the file browser to select the data files for the x and y vectors.
|
|
|
Type/Request/Component
|
After selecting the data files, define the Type, Request, and Component options for each vector. Depending on the file chosen, the options may already be filled in.
|
|
|
Start Index
|
The index number of the first data point in the subrange. The default is 1.
|
|
|
End Index
|
The index number of the last data point in the subrange. The word "last" can be used to specify the last data value in the file without knowing how many data points are in the file.
|
|
|
Increment
|
The number of points to advance when reading the subrange. For example, to read every data point in the file, enter an Increment value of 1; to read every other data point, enter a value of 2. The default is 1.
|
|
Math
|
The curve calculator is displayed, allowing you to define the vector mathematically.
|
|
Values
|
Enter the x and y data values for each point. You can cut, copy, paste, and insert data point values to the table. Click the expansion button,  , to view the Data Values dialog containing all x and y data points. , to view the Data Values dialog containing all x and y data points.
|
|
For more information on the Type, Request, and Component options, see Building Plots with Generic XY Data Files in the HyperGraph on-line help.
|
|
|
Third Menu
|
Write to solver file
Do not write to file
|
Determines whether or not the curve data is exported to the solver input deck.
|
|
|
|
Fourth Menu
|
Control points
Curve points
|
Determines if the points are to be exactly on the curve (Curve points) or used to fit the curve (Control points).
|
|
|
|
Fifth Menu
|
Open curve
Closed curve
|
Determines whether or not the first and last point should be connected for a closed curve.
Closed curve results in a continuous path for a constraint using this curve.
|
|
|
Show Curve
|
Displays a curve preview dialog.
|
Export Curve
|
Displays the Export Curve dialog, which allows you to export plot data in several different formats that can be read by other software applications.
|
Reload data
|
Reloads the contents from the selected file into memory.
|
View file
|
Displays a Preview dialog that contains the text version of the file.
|