The Curves panel allows you to add and edit curves. In MotionView, a curve entity is used to capture non-linear characteristics of forces and motion or to describe constraint paths for high-pair joint types. A 2D curve is used to represent the non-linear characteristics of forces or motion and a 3D curve can be created to use in a higher pair joint (see the Advanced Joint – PointtoCurve and Advanced Joint - CurvetoCurve topics).
Refer to the Reference Entity – Curves topic located in the MotionView Entity Manual to learn more about 2D and 3D Curves.
The x, y (and z) data vectors for a curve can come from any of three sources – File, Math, or Values. For example, the x-data vector can come from a file, and the y-data vector can be defined as a mathematical function of x.
Curves panel
The Curves panel contains the following tabs:
Properties
Attributes
Visualization
Curves can be exported to a .csv file using one of the following formats:
Note
|
Curves that are referenced in expressions should reference varname.x and varname.y. For example, crv_o.x.
In MotionView, you need to reference the varname of the curve to access its vector (crv_0.x). In HyperGraph, you can access the vector of a curve using X directly or the page-window-curve syntax, for example p1w1c1.x.
|
| 1. | From the Project Browser, select the system to which the curve is to be added. |
| 2. | Right-click on a system folder in the Project Browser and select
Add > Reference Entity > Curve from the context menu. |
OR
| - | Right-click on a curve folder in the Project Browser and select Add Curve from the context menu. |
OR
| - | Right-click the Curves button  on the Reference toolbar. on the Reference toolbar. |
The Add Curve dialog is displayed.
| 3. | Assign a label to the curve in the Label field. |
The curve label can be changed at any time.
| 4. | Assign a variable name to the curve in the Variable field. |
The variable name is required and cannot be changed after it is defined.
| 5. | Enter any notes in the Note text box |
The curve is added to the model.
|
| 1. | Select a curve in the Project Browser. |
The Curves panel is automatically displayed.
The Export curve dialog is displayed.
| 3. | Select a file type from the Type drop-down menu. |
| 4. | In the File text box, enter the name of the curve, or accept the default. |
| 5. | Click the file browser button to select a folder in which you want to save the file. |
|
| 1. | Select a curve in the Project Browser. |
The Curves panel is automatically displayed.
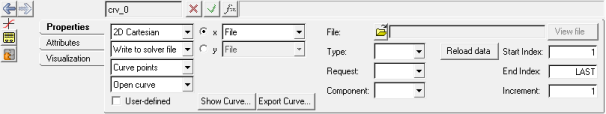
| 2. | Select the Properties tab. |
| 3. | Select the x radio button. |
| 4. | From the drop-down menu, select File. |
| 5. | Click the file browser button,  , to select a data file using the file browser. , to select a data file using the file browser. |
| 6. | Use the Type, Request, and Component selectors to select the column data to use as the x data for your curve. |
| 7. | Select the y radio button. |
If your curve previously had no y data source, MotionView automatically defaults to the y-data source to the same data file selected for x.
If you want to load the y data from a different file than the default, use the file browser to select a new file, otherwise, proceed to the next step.
| 8. | Use the Type, Request, and Component selectors to select the column data you want to use as the y data for your curve. |
The curve is displayed in the window.
|
See Also:
In the HyperGraph on-line help:
File as a Data Source
Math as a Data Source
Values as Data Source


