|
»Click here to display Table of Contents«
|

Thickness View |

|

|

|

|
|
Thickness View |
|
|
|

|
|
»Click here to display Table of Contents«
|
Thickness View |
|
|
|
|
|
Thickness View |
|
|
|
|
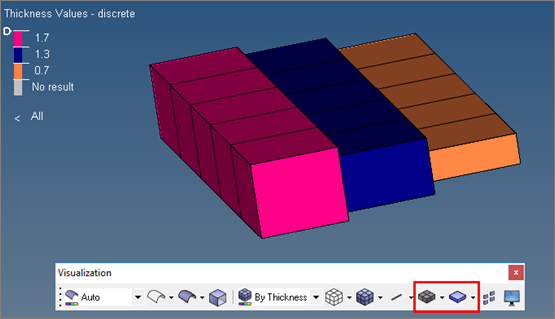
Thickness View is a permanent visualization mode that Engineering Solutions displays in the upper left-hand corner of the graphics area when you select By Thickness on the Visualization toolbar. Use this tool to investigate the shell thicknesses in your model. Both element thickness as well as node thickness is supported. The thickness colors can be shown along two different legend styles, discrete and ranged.
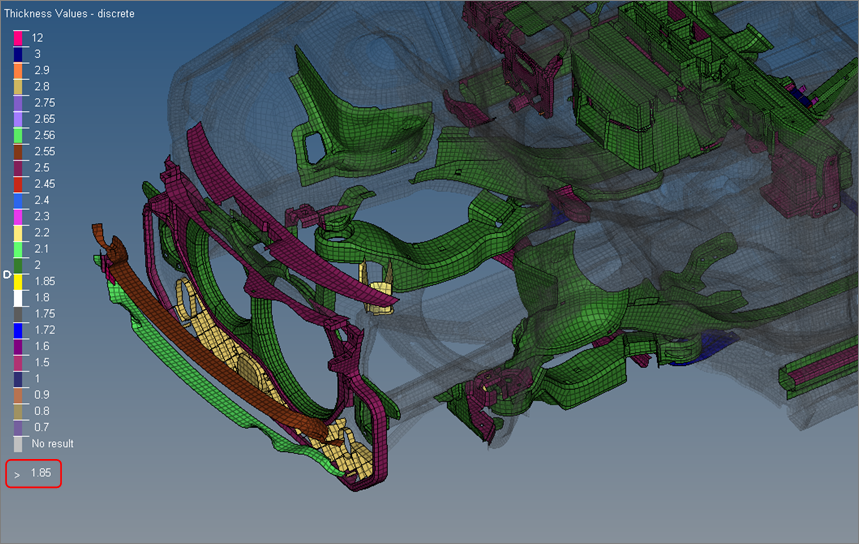
When you select Thickness View, the Discrete Thickness legend displays by default.
In the Discrete Thickness legend each individual thickness value has its own exclusive color and hence the thickness values are not editable. This legend allows the evaluation of the element thicknesses in the graphics area.
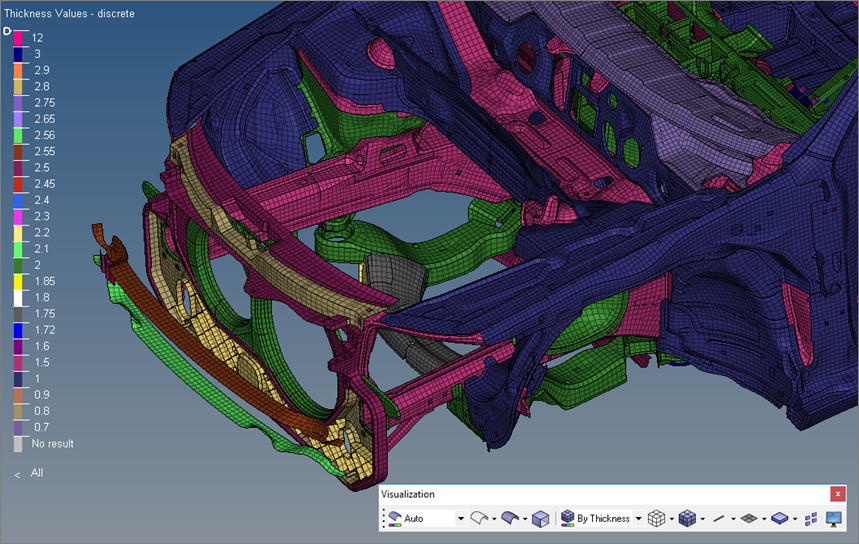
The Discrete Thickness legend always lists the thickness values from lowest to highest. If further elements are displayed and these elements have a thickness assigned, which is not yet shown in the legend, the legend will be updated appropriately and the new thickness value will be properly sorted among the other thickness values.
|
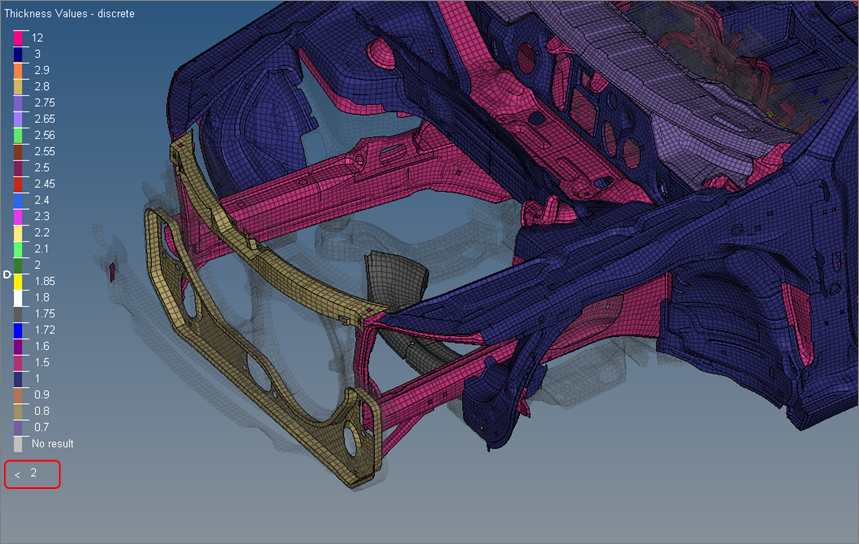
The slider, in the upper-left corner of the Discrete Thickness legend, can be used to change the display of elements beyond the threshold value. Elements can be hidden, or can be shown as transparent or wireframe. Clicking on the Operator Sign below the color bar changes it from ‘smaller than’ to ‘larger than’ and vice versa.
Reposition the slider by clicking-and-dragging it to the desired value on the legend. Same can be reached by clicking onto the thickness threshold value next to the operator sign and entering a new value. The value will be rounded to the next available thickness value.
Modify colors by clicking a color in the legend and selecting a new one from the color palette.
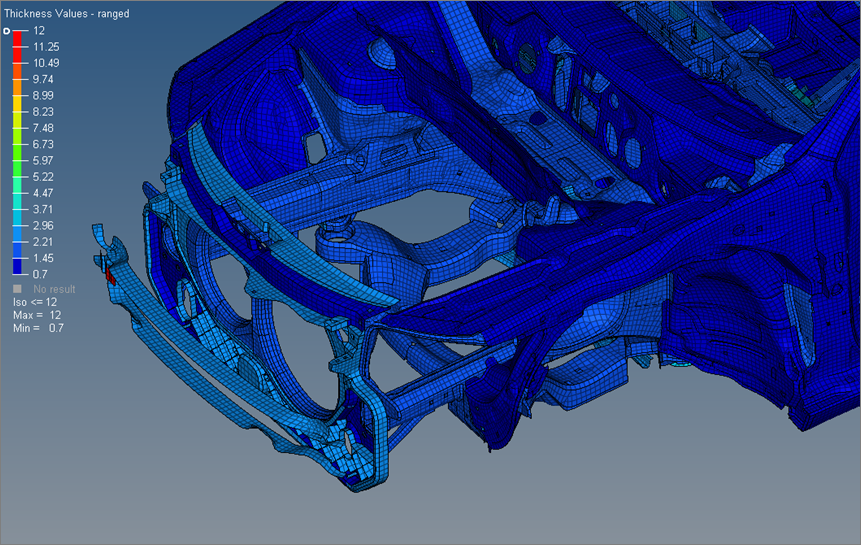
The Ranged Thickness legend consists of a color coded sliding scale. The colors exhibited reflect the thicknesses of each 2D element in the graphics area.
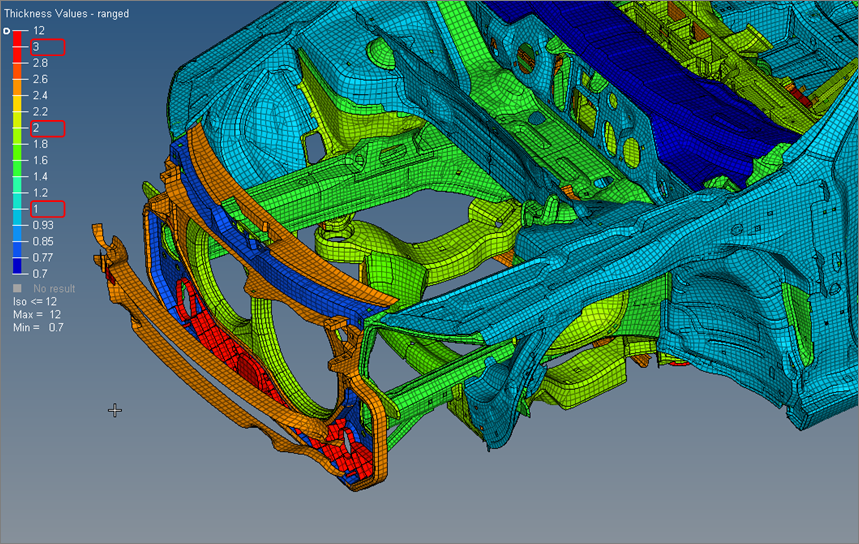
The Ranged Thickness legend always lists the thickness values from lowest to highest. Edit these values by clicking on them and entering a new value. The remaining thickness values are interpolated between other edited values and the lowest and highest value in the legend.
You can also edit the lowest and highest values, but the values cannot exceed the minimum and maximum thicknesses in the range. |
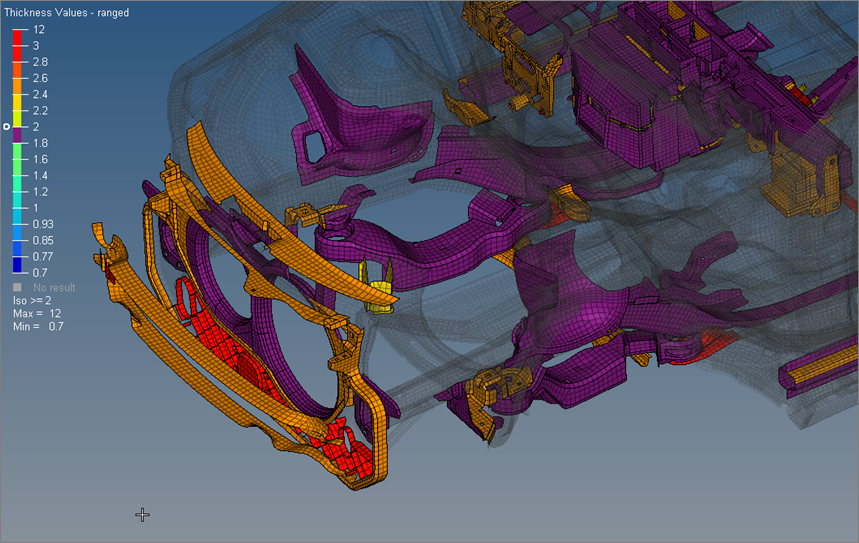
The slider, in the upper-left corner of the Ranged Thickness legend, can be used to change the display of elements beyond the threshold value. Elements can be hidden, or can be shown as transparent or wireframe. Clicking on the Operator Sign below the color bar changes it from ‘equal or smaller than’ to ‘equal or larger than’ and vice versa.
Reposition the slider by clicking-and-dragging it to the desired value on the legend. Same can be reached by clicking onto the thickness threshold value next to the operator sign and entering a new value. The value will be rounded to the next available thickness value.
Modify colors by clicking a color in the legend and selecting a new one from the color palette.
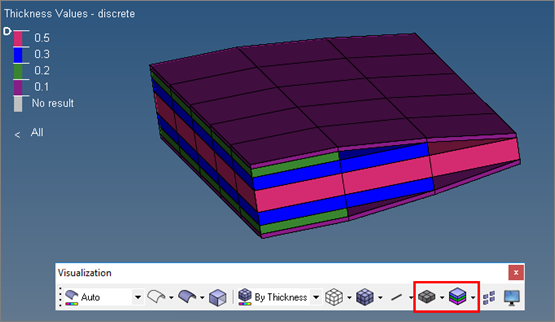
The Discrete Thickness legend and the Ranged Thickness legend are both capable of showing ply thicknesses. Any combination of 2D Detailed Element Representation and Composite Layer Visualization is supported.