Display Options |

|

|

|

|
|
Display Options |

|

|

|

|
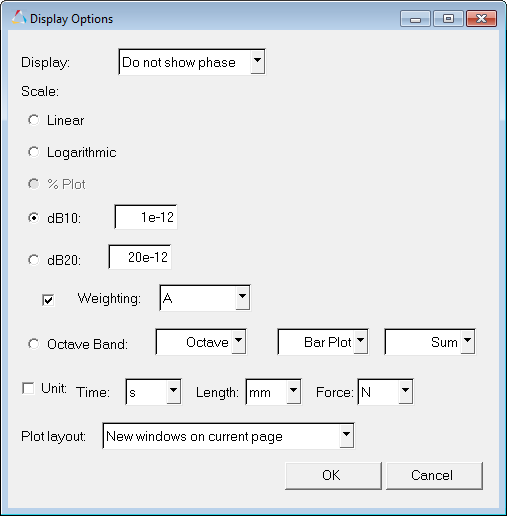
The Display Options dialog allows you to customize the response plot using the following options:

Display Options dialog
Option |
Description |
|||||||||||
|---|---|---|---|---|---|---|---|---|---|---|---|---|
Display menu |
Do not show phase - Hides the phase values on the plot. |
|||||||||||
Scale |
The following options are available under Scale: |
|||||||||||
|
Linear |
Plots the linear values. |
||||||||||
|
Logarithmic |
Plots the values in logarithmic scale. With this scale, data points are spread out more, which makes it easier to view. |
||||||||||
|
dB10 |
10 logarithmic of the participation value over the reference value. |
||||||||||
|
dB20 |
20 logarithmic of the participation value over the reference value. For acoustic responses, the reference pressure is 20E-12 MPa. |
||||||||||
|
Weighting |
Choose from Unweighted, A-, B-, C-, or D-weighting. The weighting type is used to define equal loudness sound pressure levels. |
||||||||||
|
Octave Band |
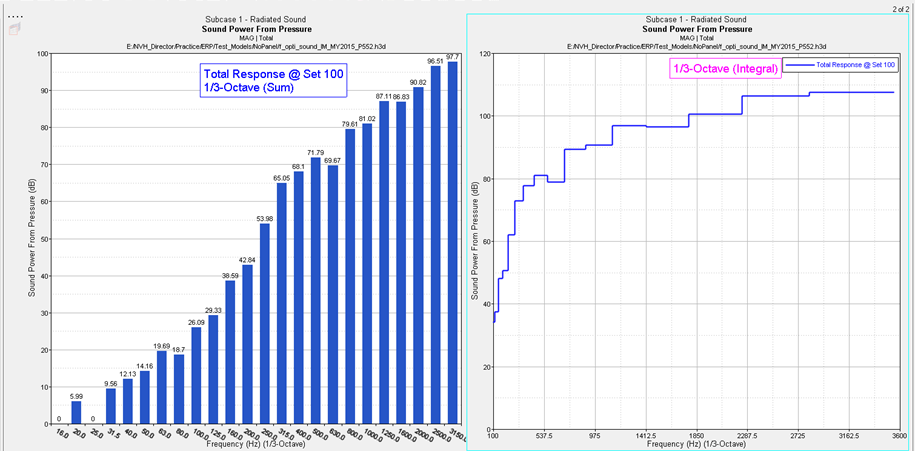
Three menus allow you to customize the plot's octave band. Select an octave band from the left-most drop-down menu:
Select Bar Plot or Line Curve as the octave plot type from the middle drop-down menu. Select Sum, Integration, or Average as the Octave Magnitude from the right-most drop-down menu. |
||||||||||
Unit |
The Unit option allows you to display unit information in the axes labels. Place a check mark in the Unit box to enable this feature; remove it to disable this feature. The entity units are derived from unit sets for Time, Length and Force. For example, the acceleration is m/s2 if Time is set to seconds (s), Length is set to meters (m), and Force is set to Newtons (N). |
|||||||||||
Plot Layout |
Allows you to select how the plot window is displayed. |
|||||||||||
New windows on current page |
Plot is placed into a new window on the current page. |
|||||||||||
Active window |
Plot is placed into the active window. |
|||||||||||
New windows on new page |
Plot is placed into a new window on a new page. |
|||||||||||
