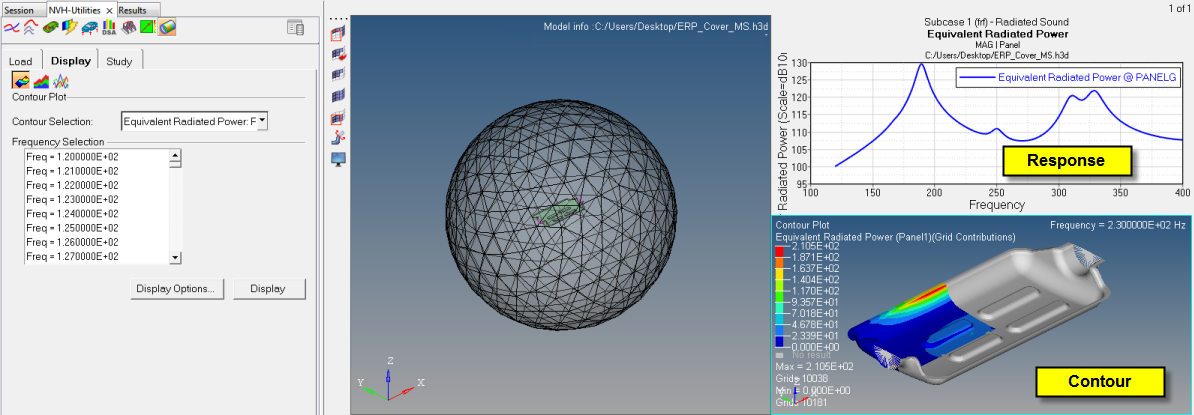
From the Display sub-tab, select a contour type and a concerned frequency. To activate this tab, you must first load a file from the Load tab.
Setting Plot Display Options
| 1. | From the NVH-Utilities tab > Radiated Sound > Display sub-tab, select a contour type: Contour,  , Sand Dune, , Sand Dune,  , or 2D Line, , or 2D Line,  . . |
| • | Make a selection from the Contour Selection drop-down menu. |
| • | Select a concerned frequency from the Frequency Selection drop-down menu. |
| • | This is the only option available if you select Sound Pressure as the result type. |
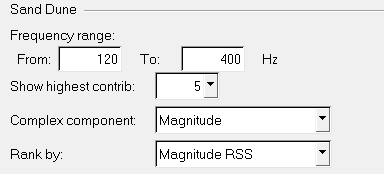
| 3. | If you select Sand Dune or 2D Line: |
| • | Under Frequency range, enter values in the From and To fields. |
| • | Select the highest number of contributors to display from the Show highest contrib drop-down menu. |
| • | For Complex component, Magnitude plots the magnitude of the complex frequency values. |
| • | For Rank by, Magnitude RSS contributors are ranked by the root sum of squares of the magnitude of their participations at selected frequencies. |
Note Sand Dune and 2D Line are not available for the Sound Pressure result type.
| 5. | Click Display to plot the contour (ERP, Sound Power, Sound Pressure). |
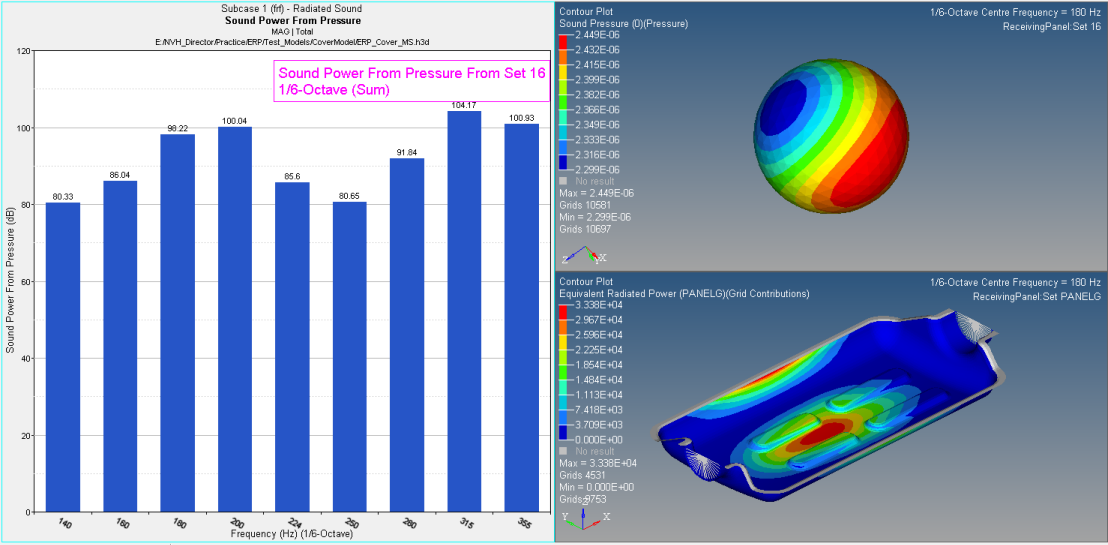
Contour example based on octave bands
See Also
Radiated Sound
Radiated Sound - Load Tab
Radiated Sound - Study Tab
Display Options


