Polar Plot |

|

|

|

|
|
Polar Plot |

|

|

|

|
There are three polar plot types supported by HyperGraph 2D: vector, phase vs. magnitude, and radar.
Polar plots allow you to plot complex data and are very similar to HyperGraph 2D complex plots. The phase axis for a polar plot is equivalent to the phase axis for a complex plot . The mag-axis for a polar plot is equivalent to the magnitude axis for a complex plot. The key differences are plotted polar coordinates - only a single frequency is displayed.
The polar plot toolbar is displayed when you select HyperGraph 2D from the application menu and the active window is set to the Polar Plot mode, ![]() .
.

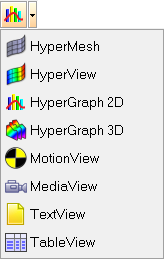
Select an application from the menu

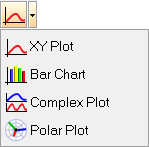
Plot type options
The following panels are available for plotting polar data:
Icon |
Panel |
Description |
|
Build Plots |
The Build Plots panel enables you to quickly construct fully annotated plots from a data file. You can create multiple plots with a single click. |
|
Define Curves |
Individual curves can be edited using the Define Curves panel. The Define Curves panel also provides access to the curve calculator. |
|
Define Tip-to-Tail Function |
Calculates and draws the tip-to-tail curve based on the current plot. |
|
Datum Lines |
Datum lines can be added to plots using the Datum Lines panel. |
|
Curve Attributes |
The appearance of each curve can be customized for clear data presentation. Line style and color, symbol style and color, and other curve attributes can be modified on the Curve Attributes panel. |
|
Coordinate Info |
Use the Coordinate Info panel to retrieve individual point data such as point index, theta and r coordinates, and the estimated slope. |
|
Scales, Offsets, and Axis Assignments |
Curve offsets and scales are set using this panel. Offset and scaling values can be applied to multiple curves on a single plot. |
|
Axes |
Axis attributes such as the scale, label, color, and number of tics are set with the Axes panel. |
|
Legends |
Legends are displayed, positioned, and their attributes are selected in the Legends panel. |
|
Headers and Footers |
Plot headers and footers can be specified on the Headers and Footers panel. |
|
Options |
Plotting options such as using even cycles when fitting log axes and the default dynamic range are set using the Options panel. |