|
»Click here to display Table of Contents«
|
Parallel Coordinate
|

|

|

|

|
|
Parallel Coordinate
|
|
|
|

|
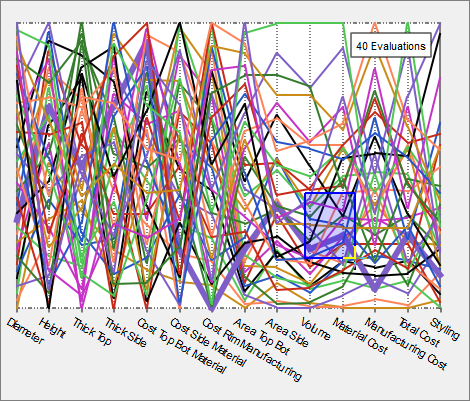
The Parallel Coordinate tab contains a visualization of all run data shown on the same plot. This style of plot is sometimes referred to as a snake plot.
Each vertical line, or axis, represents the input variables and/or output responses that are active in the Channel selector. By default, the min and max range for each selected input variable/output response is displayed at the top and bottom of an axis. Each run in the data is represented as a colored line passing through the axes.
Hovering over a run’s line displays its corresponding index. The StepIndex of the runs can also be activated as a display option. Clicking on a line highlights the line in the plot.
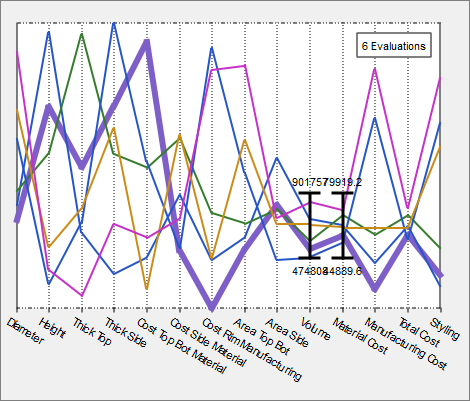
Review trends in run data by clicking-and-dragging your mouse to draw boxes around sets of lines. All of the lines included in the box remain displayed, while unselected lines disappear. A visual indicator appears, and displays the minimum and maximum values for the selected set of lines. Multiple boxes can be drawn around sets of line to review. To display all of the lines, right-click in the plot and select Reset Filter from the context menu.
For example, in the first image below, run data was selected for a set of lines. In the second image below, you can see that when Styling is low, Height is high.
|
|
For a more precise control over filtering run data, click Show Filter (located above the Channel selector). In the Coordinate Filter dialog, select input variables and output responses to plot from the Filter column, and enter Filter Min and Filter Max values.
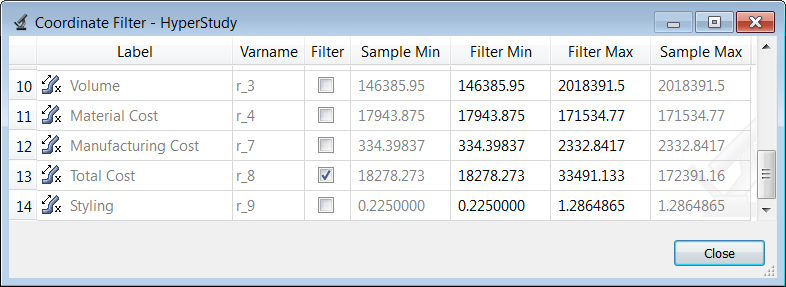
The filtering mechanisms used in the Parallel Coordinate tab are interoperable, meaning the run data you have selected using box selection in the work area will be selected in the Coordinate Filter dialog, and visa versa.
Access settings for the parallel coordinate plot from the menu that displays when you click ![]() (located above the Channel selector).
(located above the Channel selector).
| • | Absolute scale enables an absolute scale versus a relative scale which is used by default. |
| • | Show min/max turns the display of min and max ranges on and off. |
| • | Show StepIndex turns the display of the step index on and off. |