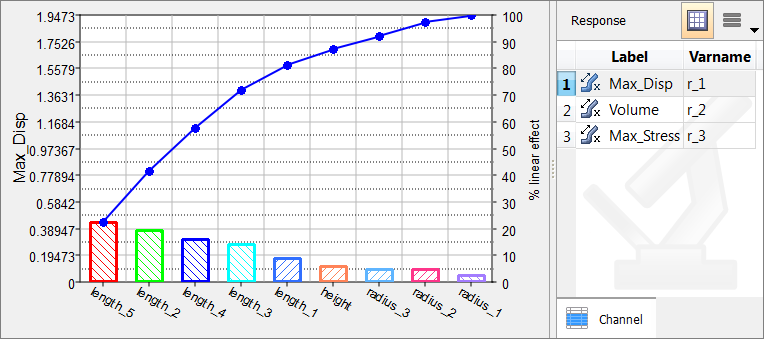
In the Linear Effects tab you can view the effects of input variables on output responses, ignoring the effects of other input variables.
To change the format linear effects are displayed, click  (Linear Effects Plot) or (Linear Effects Plot) or  (Linear Effects Table) above the Channel selector. (Linear Effects Table) above the Channel selector.
Linear Effects Plot
Linear effects are plotted by drawing a line between the average value of the output response when the input variable is at its lower bound and the average value of the output response when the input variable is at its upper bound.
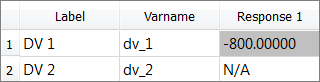
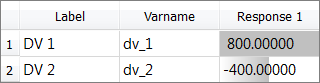
Linear Effects Table
Linear effects are calculated using a linear regression model for the normalized input variable ranges of [-1, 1]. The linear effect value of input variable x on output response f(x, y) doubles the coefficient a1 of the regression model for f(x)=a0+a1*x. That is, if the linear regression model for the output response f(x) is ao+a1*x where a1 is equal to 400.0 and x is between -1.0 and 1.0, then the linear effect of the input variable x on the output response f(x,y) is 800.0.
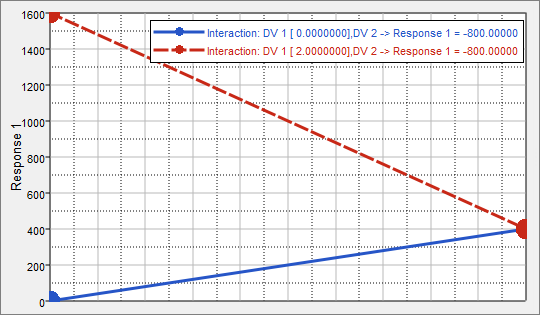
For 2-level design of experiments, linear effect values can also be calculated as the difference between the average output responses when the input variable is at its lower value and when the input variable is at its upper value.
Given a 2-factor, 2-level full factorial DOE matrix over the design space of [0:2] on both parameters as:
Run
|
X
|
Y
|
F(X,Y)
|
1
|
0
|
0
|
1
|
2
|
0
|
2
|
401
|
3
|
2
|
0
|
1601
|
4
|
2
|
2
|
401
|
Design Matrix
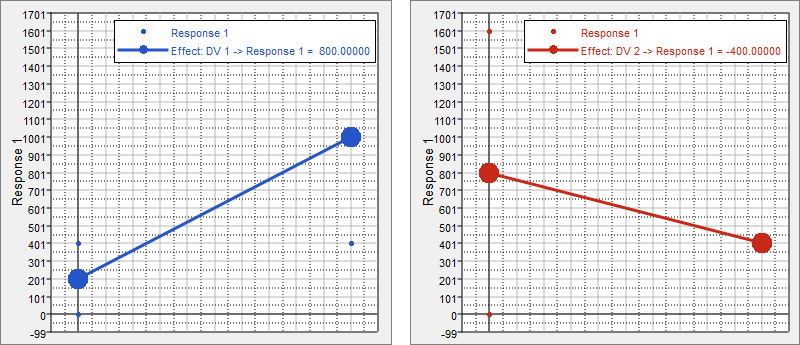
| • | When X is at lower level, the mean output response is (1 + 401) / 2 = 201 |
| • | When X is at upper level, the mean output response is (1601 +401) / 2 = 1001 |
| • | The effect of X on F is then (1001 - 201) = 800 |
| • | When Y is at lower level, the mean output response is (1 + 1601) / 2 = 801 |
| • | When Y is at upper level, the mean output response is (401 + 401) / 2 = 401 |
| • | The effect of Y on F is then (401 - 801) = -400 |
|