Use the following tools for post processing computational results from an Optimization:
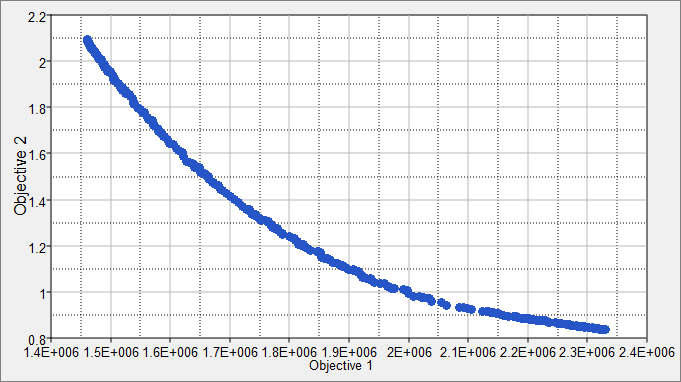
A particularly interesting use case occurs in the Iterations tab, when post-processing multi-objective optimization problems and visualizing the Pareto front. The Pareto front is a trade-off between competing objectives, where one individual objective cannot get better without another objective becoming worse.
In the Iterations tab, any two objectives can be selected for plotting on the x and y-axis. In the Iterations History table, located in the Channel tab, you can choose which iterations of the optimization problem you would like to be plotted in the graph.
| Note: | If you select all the iterations of the optimization problem, the complete iteration history will be plotted accordingly, potentially including iterations with a violated constraint. |
|
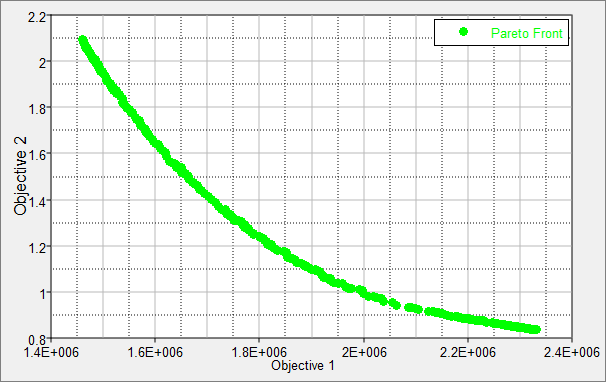
In order to see only the optimal iterations, a filter can be applied to the iteration history’s Best Step Major column. A non-blank entry indicates an optimal Pareto point. By filtering the entries to only include non-blank entries and selecting all of the designs in the list (can be done by clicking on the iteration history column), the Pareto front can be seen (see image below).
|
The Optima tab displays a a plot of two different quantities. This is frequently done to plot multiple objectives against eachother, which is known as a Pareto Front.
Review Iteration Detail
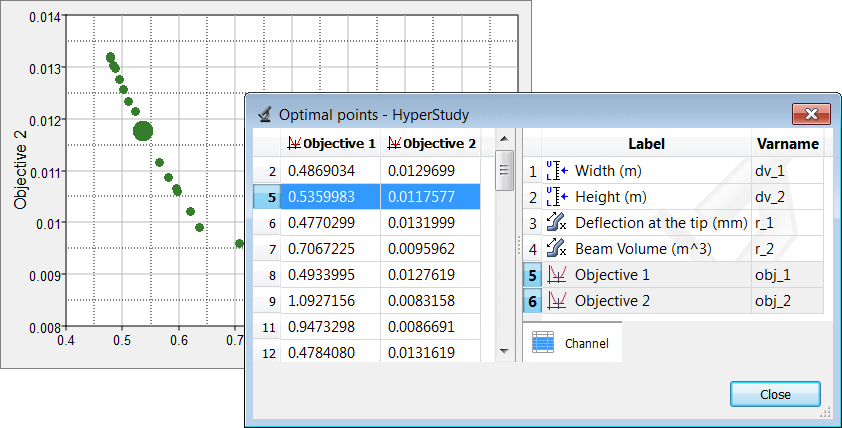
Query data on the Pareto Font by right-clicking in the work area and selecting Iteration detail from the context menu. In the Optimal points dialog, the row of data selected in the list of optimal points is marked in the original plot to enable you to easily identify the data and run pairs.
|
See Also
Optimization Fundamentals


