Use the Reliability and Reliability Plot tools for post processing computational results from a Stochastic.
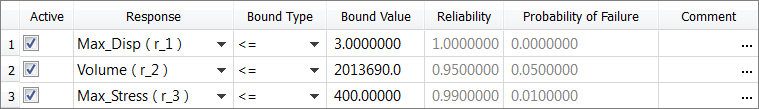
Enter a threshold value for the selected output response to see the percentage of designs that would satisfy the constraint; this percentage is known as the reliability. The remaining percentage indicates the probability of failure.
|
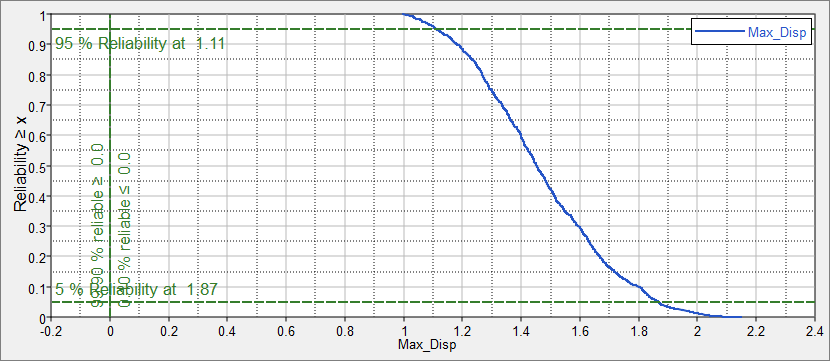
Plots the relationship between the desired threshold and the reliability of the system. Refer to the vertical axis to locate a desired reliability and find the corresponding x-axis value of the curve to identify the required threshold. For example, "To have 95% reliability I would have to design this value." You can also find a threshold from the x-axis and locate the corresponding reliability. For example, "91% of my designs are below X value". The latter use case is more common.
|
See Also
Stochastic Fundamentals


