Grid Participation - Load Tab |

|

|

|

|
|
Grid Participation - Load Tab |

|

|

|

|
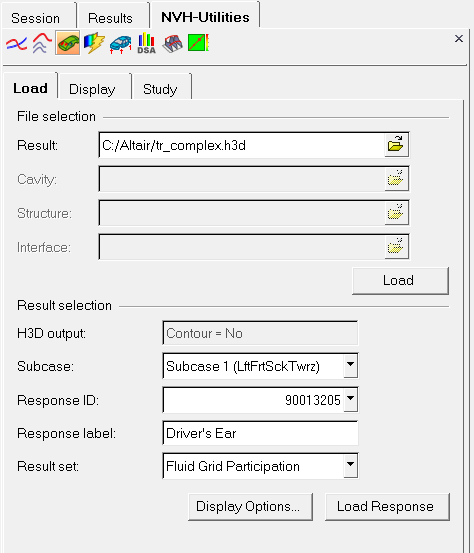
From the NVH-Utilities tab > Grid Participation > Load sub-tab, select the file(s) and result options that you want to plot grid participation data for.

NVH-Utilities Browser - Grid Participation - Load tab
File selection |
Use the following file browsers to select the file(s) that you would like to load. |
Result |
Select the result file using the file browser (.h3d, .pch, .res, or .op2).
|
|||
Cavity |
Select the model file which contains the solid elements for the cavity (.fem, .dat, or .bdf). *This file is not required if an OptiStruct .h3d or MSC Nastran .op2 file is loaded into the Result file field. |
|||
Structure |
Select the model file which contains the solid elements for the structure (.fem, .dat, or .bdf). *This file is not required if an OptiStruct .h3d or MSC Nastran .op2 file is loaded into the Result file field. |
|||
Interface |
Select the model file which contains the elements *This file is not required if an OptiStruct .h3d or MSC Nastran .op2 file is loaded into the Result file field. |
Load |
Click Load to load the files designated in the File selection section of the tab. Upon reading the file, the Result selection fields are populated (see below). |
Result selection |
The following fields are available under Result selection. Once the result selection options are complete, select Load Response to further investigate the participations. |
H3D output |
The H3D output option. Contour = Yes - means that the grid participation results have been output in a format that is ready for contouring (which reduces the amount of processing required for HyperView). Contour = No - means that the grid participation results have been output in a raw, unprocessed format. |
|||
Subcase |
Displays the various subcases and their scale types available for selection from the drop-down menu - (s) indicates a scalar-type result, (c) indicates complex results, (t) indicates a tensor-type result, and (v) indicates a vector-type result.
|
|||
Response ID |
Grid ID of the response for which Grid participation results are available. Select one from the drop-down menu. |
|||
Response label |
Enter a label that describes the response, for example |
|||
Result set |
Select either a Structure Grid Participation plot or a Fluid Grid Participation plot. |
Display Options |
Customize the response plot, including scale, weighting, and the plot layout. |
||||
Load Response |
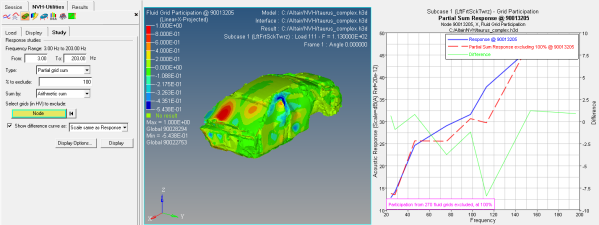
Apply the grid participation plot in the graphics area (see the example below). The response study is meant to accomplish two goals:
See the HyperGraph User's Guide for additional information on plotting. |

An example of a response study