Using Plots to View Grid Participation |

|

|

|

|
|
Using Plots to View Grid Participation |

|

|

|

|
In HyperView, the NVH Grid Participation utility allows you to create and view contour plots by selecting various scales, grids, and grid IDs for the specified Structure or Fluid grid participation. When you launch HyperView, the NVH preferences file is automatically loaded. However, you must activate the NVH-Utilities preferences file before you can use the utility.
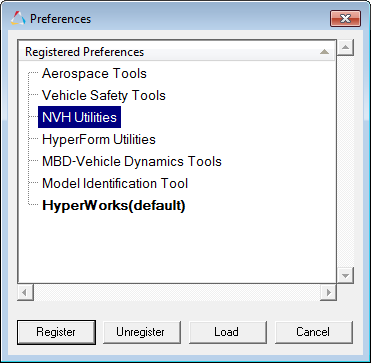
| 1. | From the File menu, select Load > Preference File. The Preferences dialog is displayed. |
| 2. | From the Preferences dialog, select NVH-Utilities and click Load. The NVH menu is added and displayed on the menu bar. |

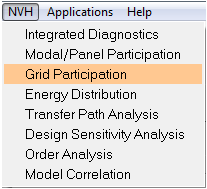
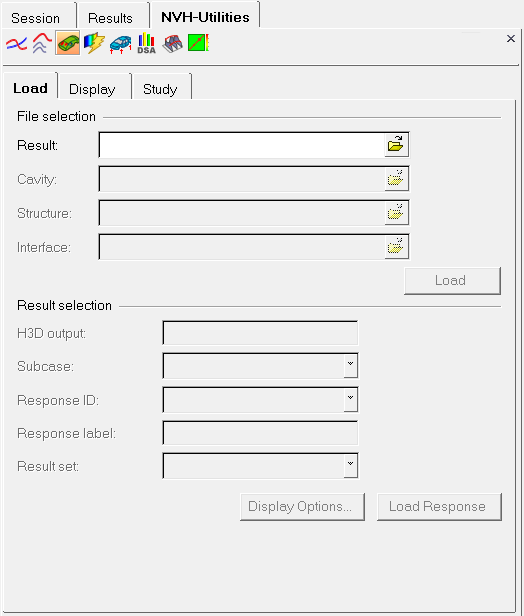
| 3. | From the NVH menu, select Grid Participation. An NVH-Utilities tab is added to the Browser (with the Grid participation icon highlighted |


NVH-Utilities tab - Grid participation - Load tab
| 4. | To close the NVH-Utilities tab, click on the X in the upper right corner of the dialog. |
See Also:
Grid Participation - Display Tab