Grid Participation - Study Tab |

|

|

|

|
|
Grid Participation - Study Tab |

|

|

|

|
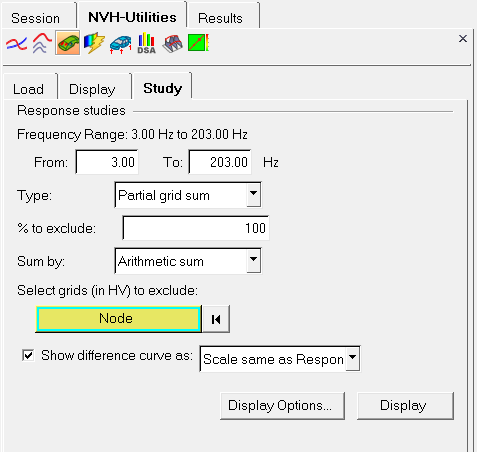
From the Study sub-tab, you can perform a Partial grid sum or Phaseless sum response study. To enable this option, you must first load a grid participation contour plot.

NVH-Utilities Browser - Grid Participation - Study tab
Frequency Range: |
Indicates the available range, based on the file loaded. Using the From and To fields, you can customize your own frequency band. |
Type |
Select the type of response study. |
Partial grid sum |
Select a number of grids to exclude from the partial sum response, with an optional percentage to exclude. |
|
Phaseless sum |
Participation results from various grids are summed based on the magnitude only (without considering phase). Normally, both magnitude and phase are taken into consideration when grid participations are summed to calculate the response. |
% to exclude |
Optional field that allows you to exclude a percentage of the contributors from the response. |
Sum by |
|
Arithmetic sum |
Participation results from various grids are summed based on the arithmetic sum of the complex grid participation. |
|
Magnitude RSS |
Participation results from various grids are summed based on the root sum of squares of the magnitude of the complex grid participation. |
Select grids |
Click the Node input collector to display the Extended Entity Selection Menu which will allows you to select the grid that you would like to exclude from the response study. OR Activate the Node input collector and pick nodes directly on the model in the graphics area (to select the grid that you would like to exclude from the response study). |
Show difference |
|
% of Response |
Plot the difference curve using a percentage of response scale and a new axis on the right hand side of the plot. |
|
Scale same as Response |
Plot the difference curve using the same scale as the one used to plot the response and a new axis on the right hand side of the plot. |
Display Options |
Launches the Display Options dialog, which allows you to customize the response study plot, including scale, weighting, and the plot layout. |
Display |
Display the response study plot once your selections are complete (see the HyperGraph User's Guide for additional information). |