Grid Participation - Display Tab |

|

|

|

|
|
Grid Participation - Display Tab |

|

|

|

|
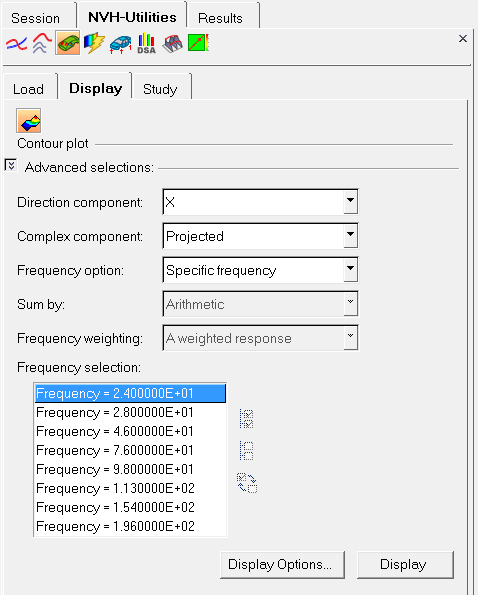
From the Display sub-tab, select from the following options to display a grid participation contour plot on the model. To activate this tab, you must first load a file from the Load tab.

NVH-Utilities Browser - Grid Participation - Display tab
Direction component |
|
|
X |
Grid participation results from the X component of grid vibration. |
|
Y |
Grid participation results from the Y component of grid vibration. |
|
Z |
Grid participation results from the Z component of grid vibration. |
|
Sum of XYZ |
Arithmetic sum of the grid participation results from the X, Y, and Z components of grid vibration. |
Complex component |
Projected |
Complex grid participation results are first projected to the response, and the resulting scalar values are then contoured. |
|
Real |
Real parts of the complex grid participation results are contoured. |
|
Imaginary |
Imaginary parts of the complex grid participation results are contoured. |
|
Magnitude |
The magnitudes of the complex grid participation results are contoured. |
|
Phase |
The phases of the complex grid participation results are contoured. |
Frequency option |
Specific frequency |
Select a specific frequency to contour grid participation results. |
|
Sum of frequencies |
Select multiple frequencies and sum the results corresponding to these frequencies to generate one contour plot. |
Sum by |
Arithmetic |
Select how grid participation results from different frequencies are to be summed together to generate one contour plot. |
Frequency weighting |
|
A |
Use 'A weighting' to scale sum grid participation results from different frequencies. 'A weighting' is used to define equal loudness sound pressure levels. |
|
Equal |
Use 'Equal weighting' to sum grid participation results from different frequencies. |
Frequency List |
A listing of all of the frequencies available for plotting. Use the Display All |
Display Options |
Customize the plot, including scale, weighting, and the plot layout. |
Display |
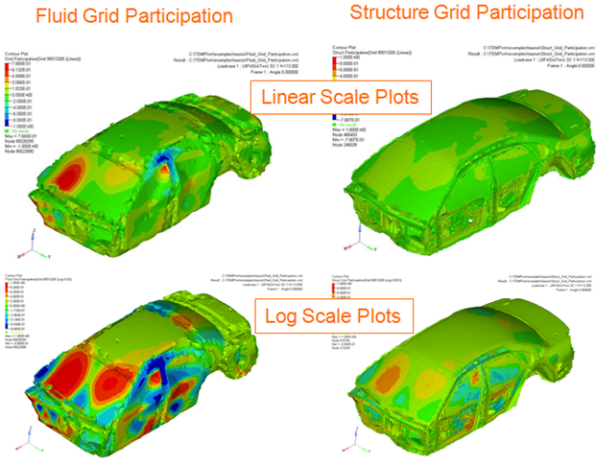
Once the result selection options and display options are complete, click Display to apply the fluid or structure grid participation contour plot to the model. This will allow you to look for the particular area of the structure which has the most positive (in-phase) contributions and also the area that has the most negative (out-of-phase) contributions. You can then effectively reduce the acoustic response at a grid point by reducing the vibration/contribution coming from the positive/in-phase area, or by increasing the vibration/response in the negative contribution area. In addition, you can also view and move through the various frequencies from the grid participations (in order to determine the positive and negative contributions) by clicking on the various frequencies located in the Frequency List. You can then apply additional fluid or structure grid plots, using log or linear or linear scale types, in order to isolate the most significant areas (see the example below): |

The change in vibration results in reduced Structure participation and Fluid participation