|
»Click here to display Table of Contents«
|

17.2 - Transitions |

|

|

|

|
|
17.2 - Transitions |
|
|
|

|
|
»Click here to display Table of Contents«
|
17.2 - Transitions |
|
|
|
|
|
17.2 - Transitions |
|
|
|
|
TitleBox Beam - Transitions |
|
||||||||
Number17.2 |
|||||||||
Brief DescriptionA steel box beam, fixed at one end, impacted at the other end by an infinite mass. Results for meshes with different transitions are compared. |
|||||||||
Keywords
|
|||||||||
RADIOSS Options
|
|||||||||
Input FileMesh 0: <install_directory>/demos/hwsolvers/radioss/17_BoxBeam/Transition_mesh/mesh0/...//BOXBEAM* Mesh 1: <install_directory>/demos/hwsolvers/radioss/17_BoxBeam/Transition_mesh/mesh1/...//BOXBEAM* Mesh 2: <install_directory>/demos/hwsolvers/radioss/17_BoxBeam/Transition_mesh/mesh2/...//BOXBEAM* Mesh 3: <install_directory>/demos/hwsolvers/radioss/17_BoxBeam/Transition_mesh/mesh3/...//BOXBEAM* |
|||||||||
Technical / Theoretical LevelAdvanced |
|||||||||
A steel box beam fixed at one end, is impacted at the other end by an infinite mass. The dimensions of the box beam are 203 mm x 50.8 mm x 38.1 mm, and its thickness is 0.914 mm. As symmetry is taken into account, only one quarter of the structure is modeled. Four kinds of mesh and three plasticity formulations are compared (global plasticity, five integration points and iterative plasticity).
Units: mm, ms, g, N, MPa
The material used follows an isotropic elasto-plastic material (/MAT/LAW2) with the Johnson-Cook plasticity model, having the following characteristics:
| • | Initial density: 7.8 x10⁻³ g/mm3 |
| • | Young modulus: 210000 MPa |
| • | Poisson ratio: 0.3 |
| • | Yield stress: 206 MPa |
| • | Hardening parameter: 450 MPa |
| • | Hardening exponent: 0.5 |
| • | Maximum stress: 340 MPa |
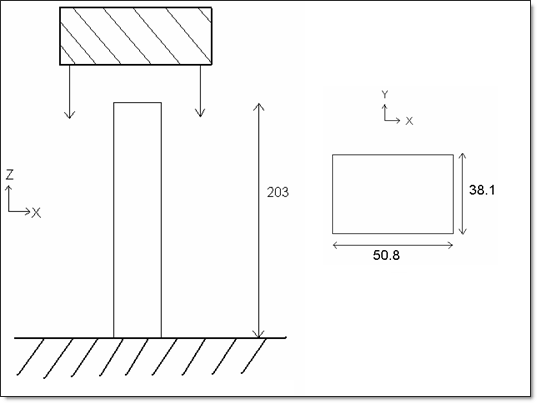
Fig 26: Problem studied
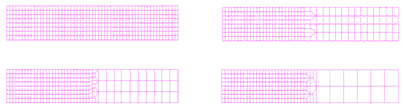
Four types of mesh are used to model the beam. The beam is divided into two parts: a fine mesh for one half (8 x 26 elements) and a coarse mesh for the other half. Transition between the two meshes of a single beam is carried out using a mesh transition element of the same length as each particular case. You will compare results using a reference case which has a uniform mesh.
The layout of the elements is shown in the following diagram. The following are tested for each model:
| 1. | Element formulation: |
| • | BT_TYPE1 |
| • | BT_TYPE3 |
| • | QEPH |
| • | BATOZ |
| • | C0 |
| • | DKT18 |
| 2. | Plasticity: |
| • | Global plasticity |
| • | Progressive plasticity with five integration points |
| • | Iterative plasticity with five integration points and variable thickness |
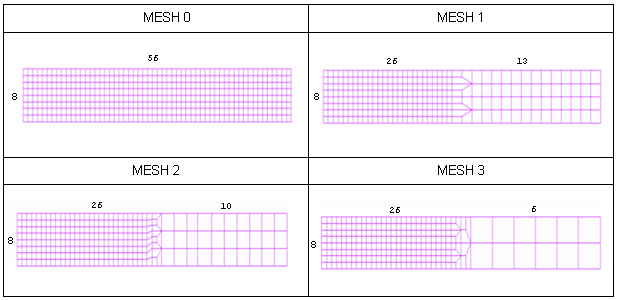
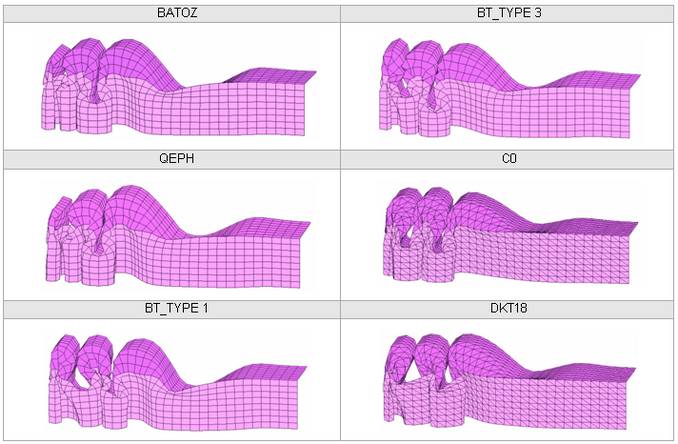
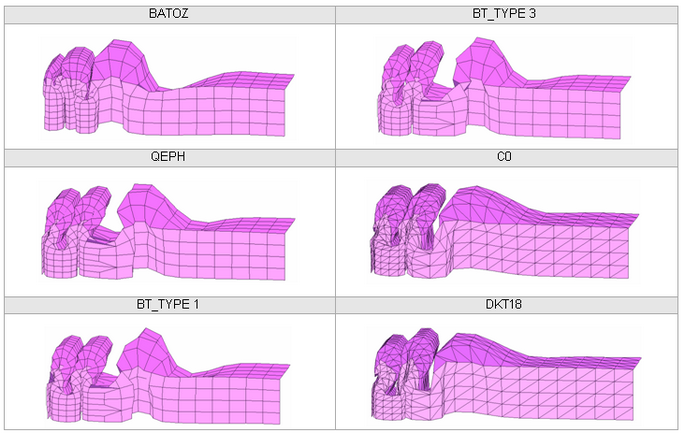
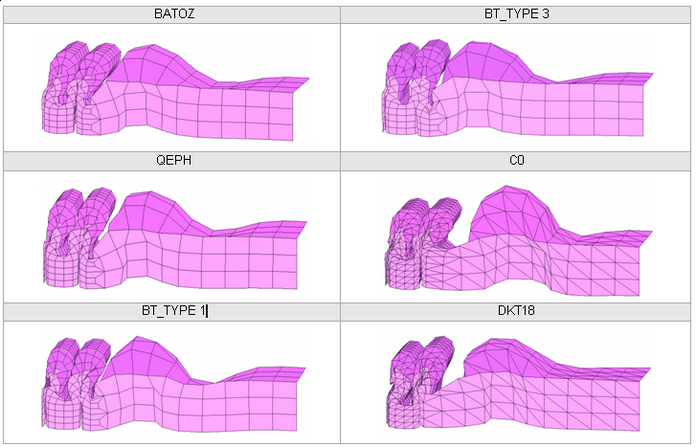
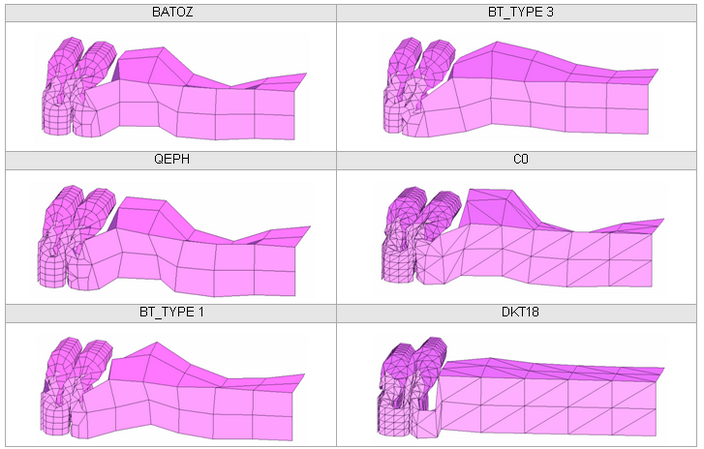
Fig 27: Meshes
| • | Boundary conditions: |
Take into account the symmetry, all nodes in the Y-Z plan are fixed in a Y translation and an X and Z rotation. One quarter of the structure is modeled.
| • | Rigid body: |
The lower (fixed) end is modeled using a rigid body connecting all lower nodes (Z = 0.0). The rigid body is completely fixed in translations and rotations.
| • | Wall: |
The impactor is modeled by a sliding rigid wall using a fixed velocity (13.3 m/s) in the Z-direction and fixed for other translations and rotations.
| • | Interfaces: |
The structure’s self-impact is modeled using a type 7 interface on the full structure. The interface master surface is defined using the complete model. The slave nodes group is defined using the master surface.
On top of the beam, the possible edge-to-edge impacts are dealt with using a type 11 self-impacting interface. The edges use the master surface of the type 7 interface as the input surface.
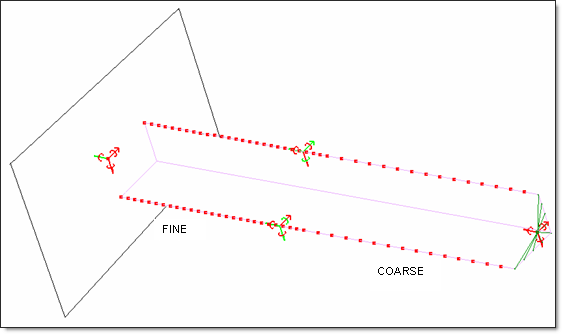
Fig 28: Boundary conditions.
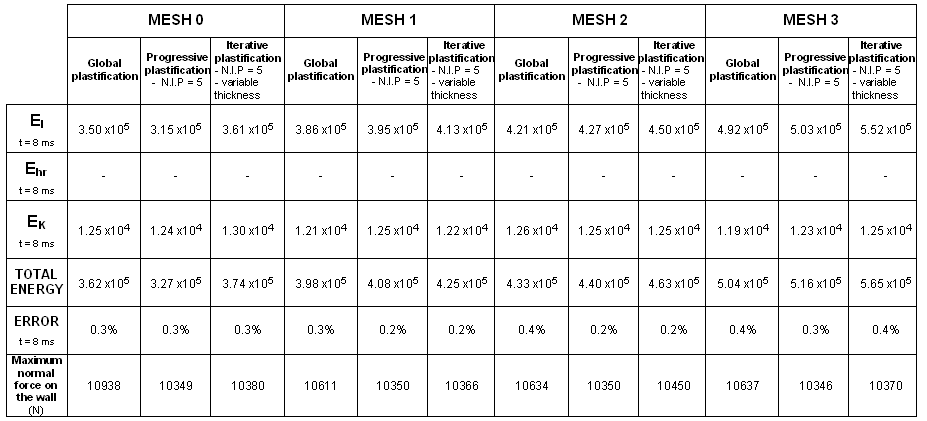
The results are compared using three different views:
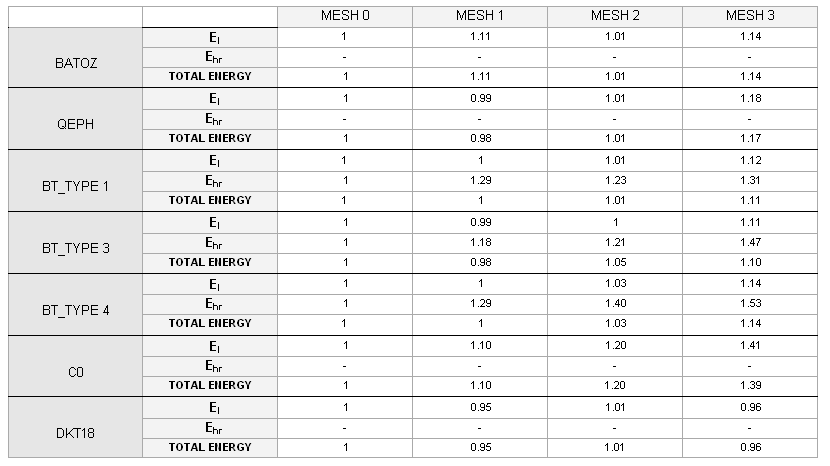
| • | Role and influence of the mesh for a given type of element formulation |
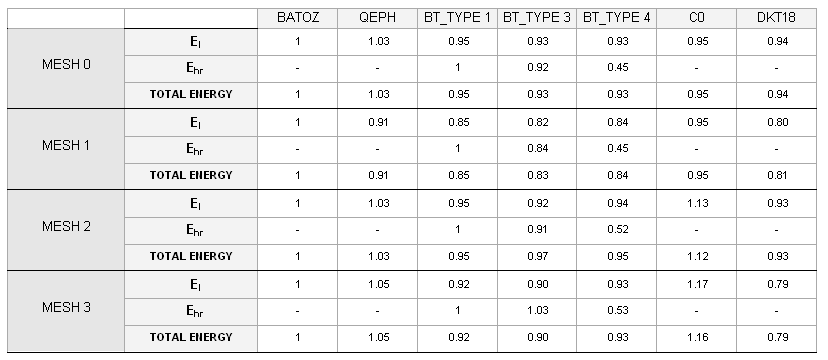
| • | Shell element formulations for a given mesh |
| • | Plasticity options for a given mesh and element formulation |
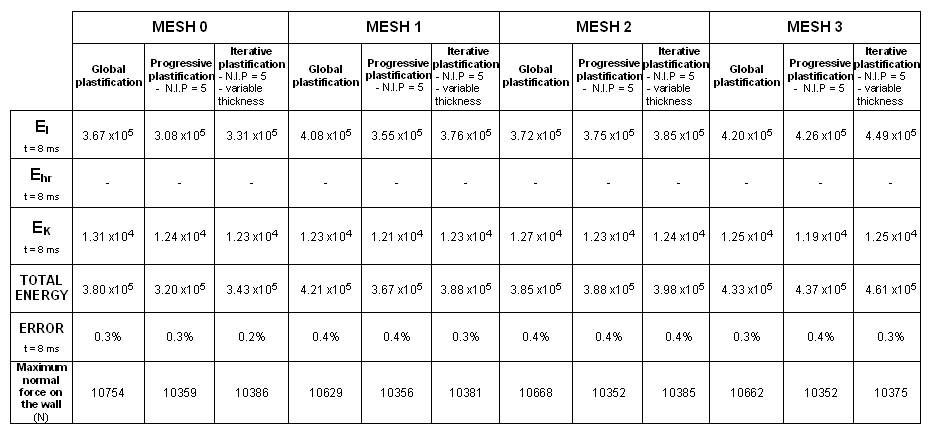
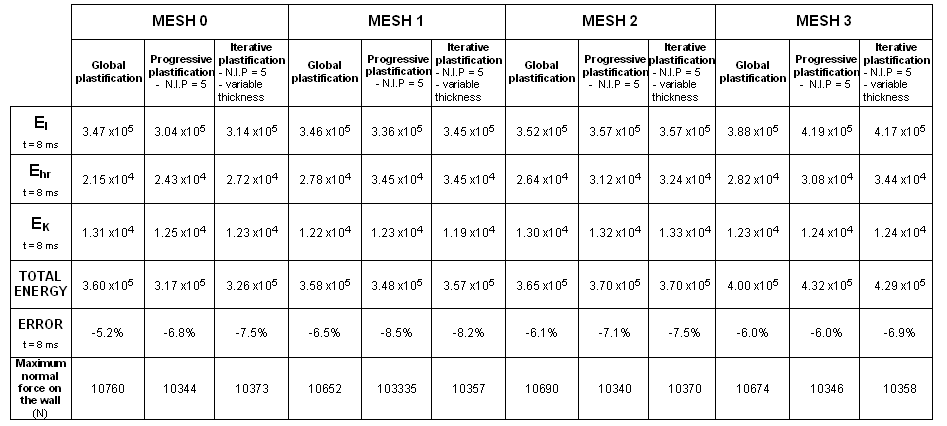
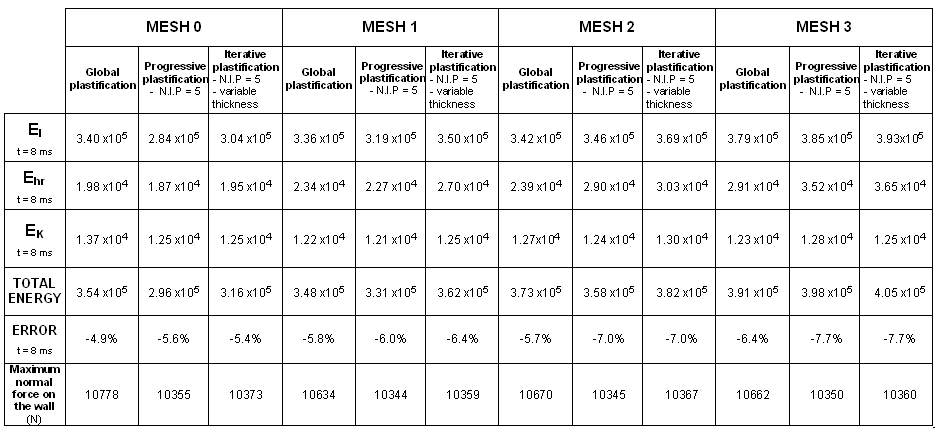
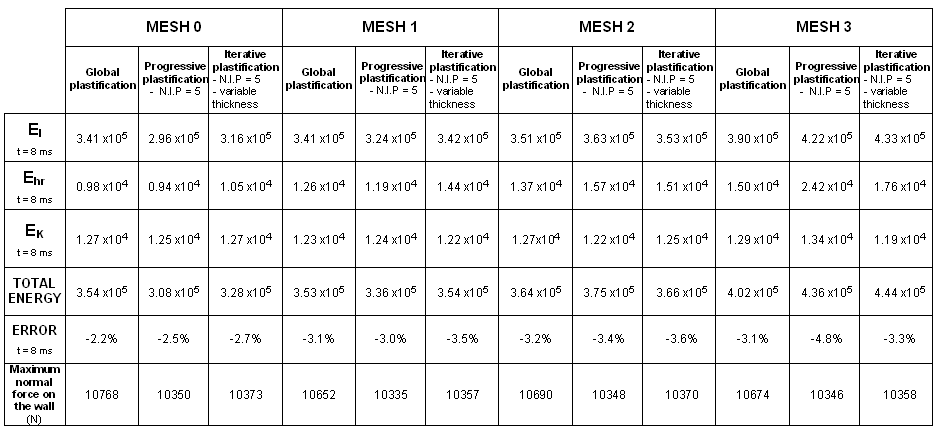
Three criteria are used to compare the quality of the results obtained:
| • | Crushing force versus displacement |
The crushing force corresponds to the normal force in the Z-direction of the impactor (rigid wall), multiplied by 4 due to symmetry.
For comparison, displacement corresponds to the Z-direction motion of the rigid wall’s master node.
| • | Hourglass energy |
| • | Total energy |
Total energy is the sum of all energies.
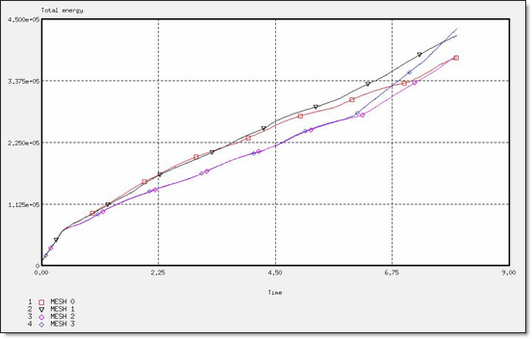
Fig 29: Total energy for a BATOZ formulation.
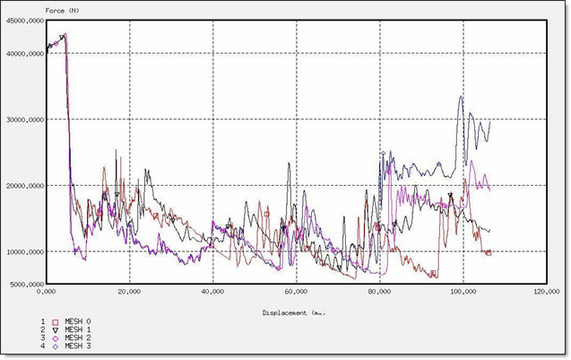
Fig 30: Force for a BATOZ formulation.
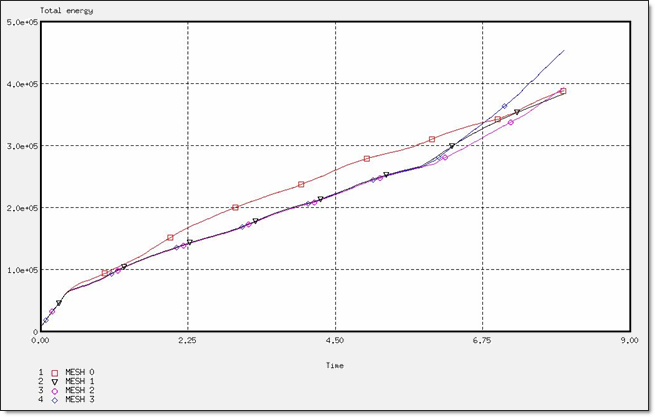
Fig 31: Total energy for a QEPH formulation.
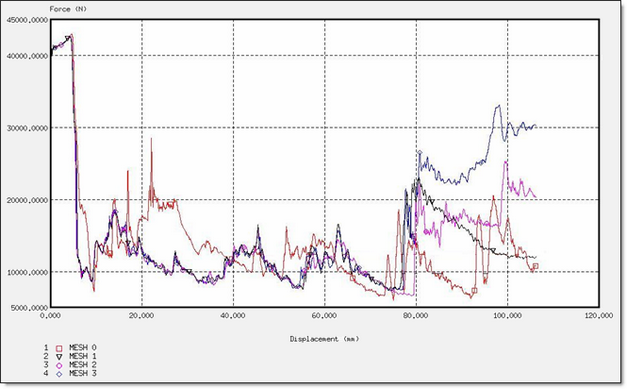
Fig 32: Force for a QEPH formulation.
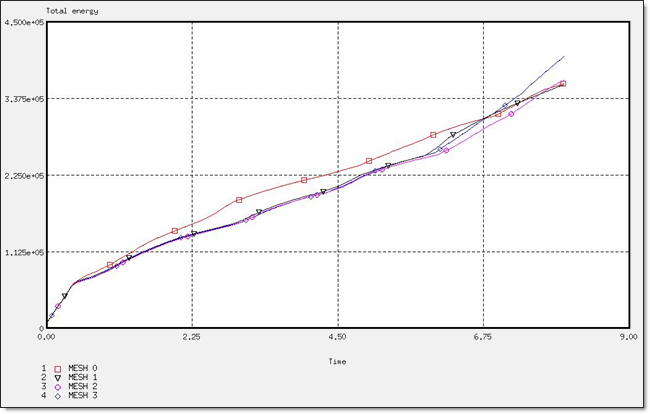
Fig 33: Total energy for a BT_TYPE1 formulation.
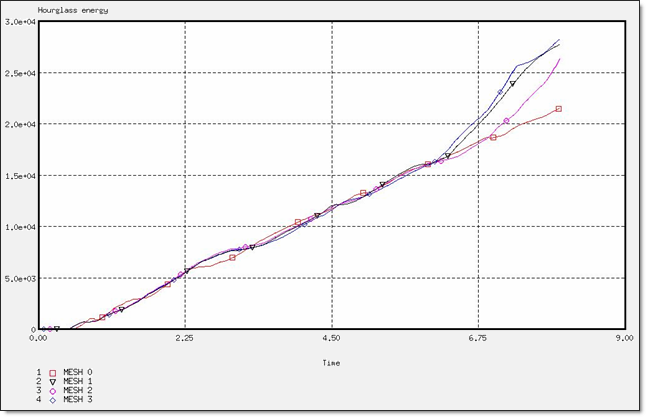
Fig 34: Hourglass energy for a BT_TYPE1 formulation.
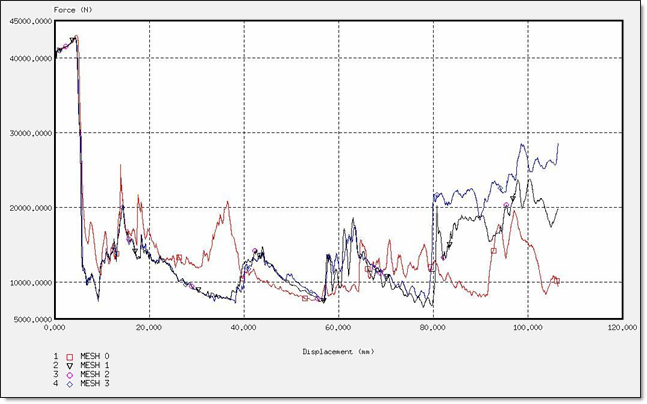
Fig 35: Force for a BT_TYPE1 formulation.
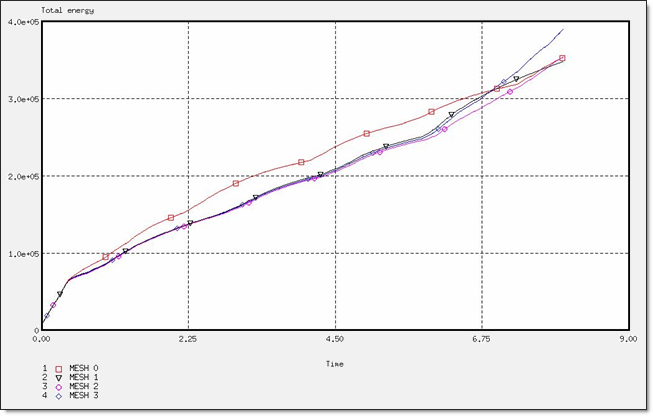
Fig 36: Total energy for a BT_TYPE3 formulation.
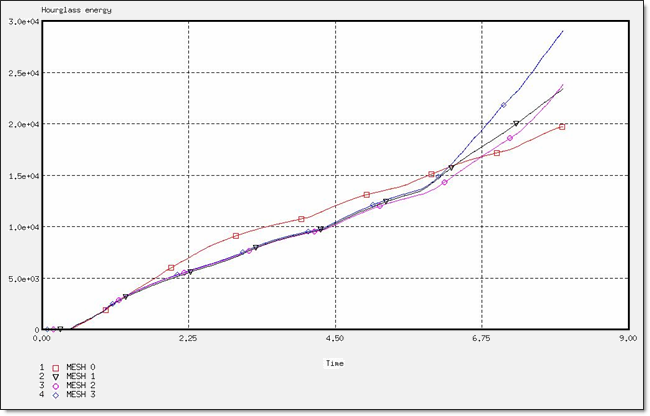
Fig 37: Hourglass energy for a BT_TYPE3 formulation.
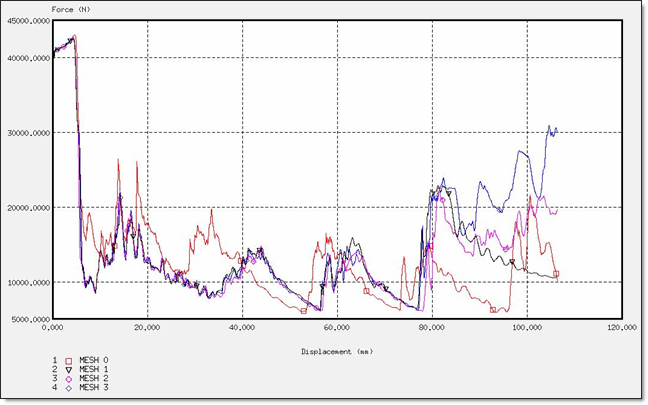
Fig 38: Force for a BT_TYPE3 formulation.
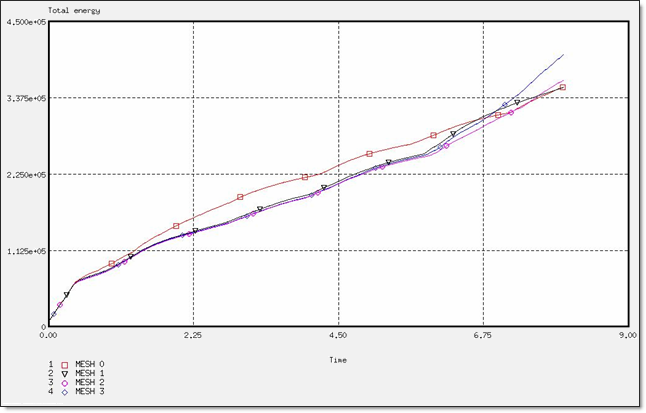
Fig 39: Total energy for a BT_TYPE4 formulation.
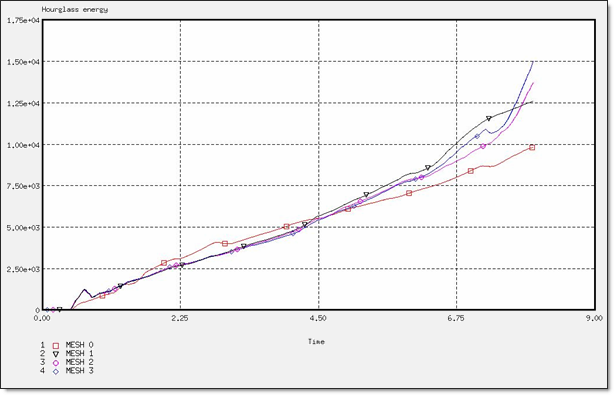
Fig 40: Hourglass energy for a BT_TYPE4 formulation.
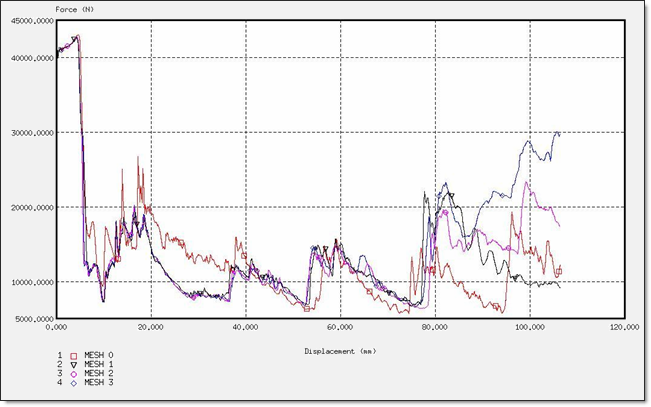
Fig 41: Force for a BT_TYPE4 formulation.
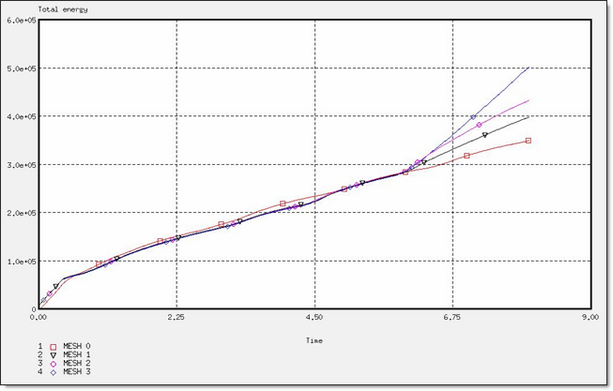
Fig 42: Total energy for a CO formulation.
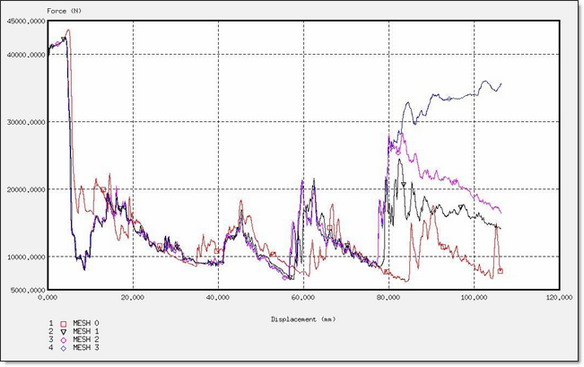
Fig 43: Force for a CO formulation.
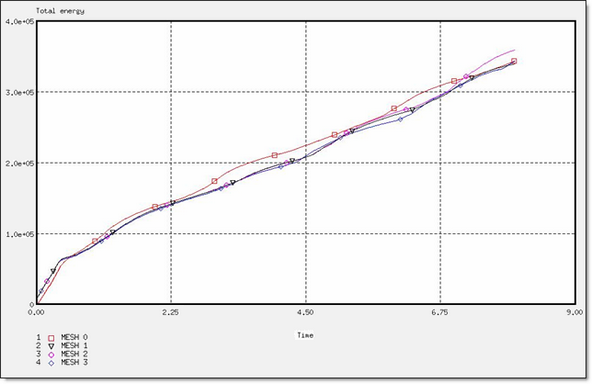
Fig 44: Total energy for a DKT formulation.
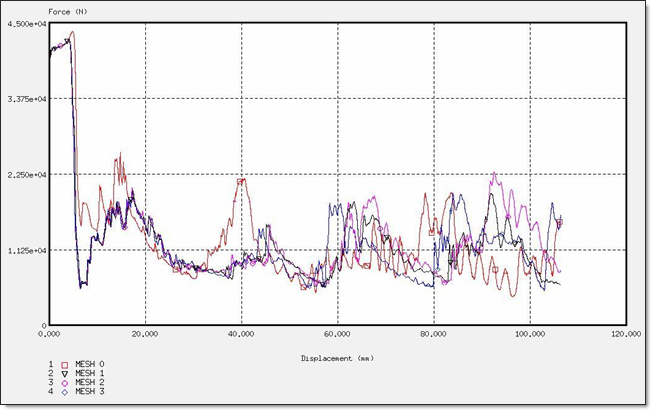
Fig 45: Force for a DKT formulation.
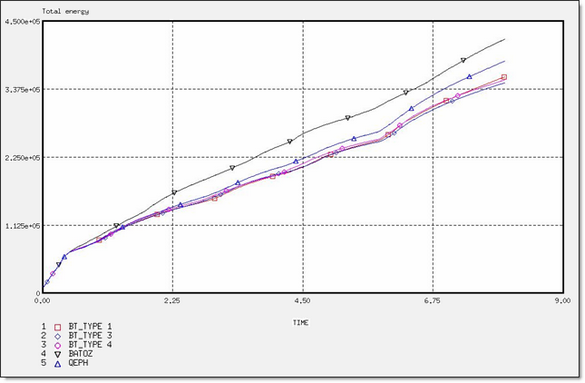
Fig 46: Total energy for different element formulations.
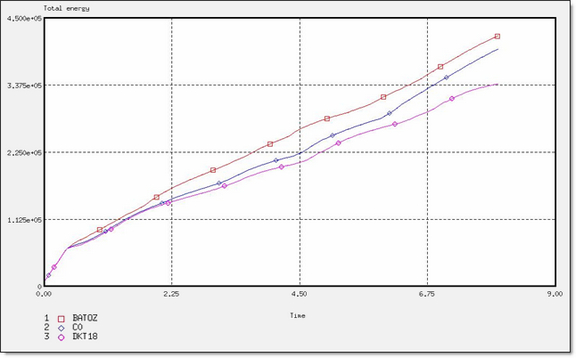
Fig 47: Total energy for different element formulations.
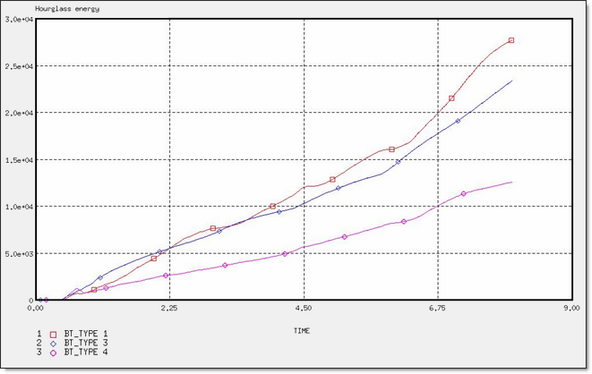
Fig 48: Hourglass energy for different element formulations.
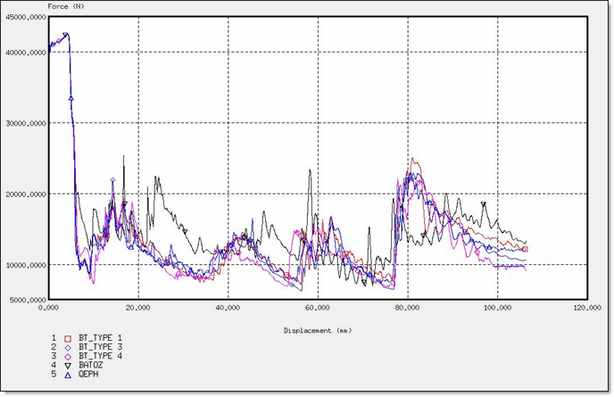
Fig 49: Force for different element formulations.
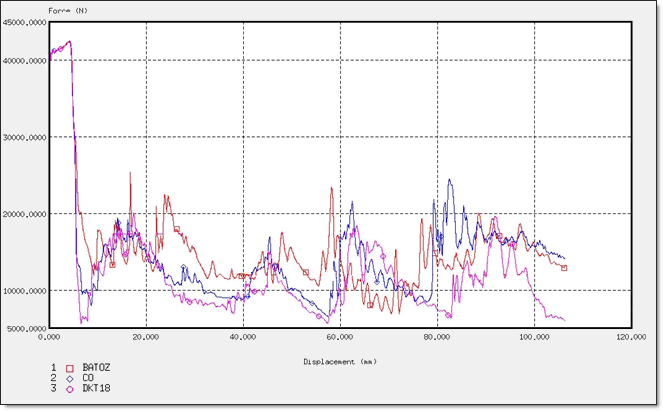
Fig 50: Displacements for different element formulations.
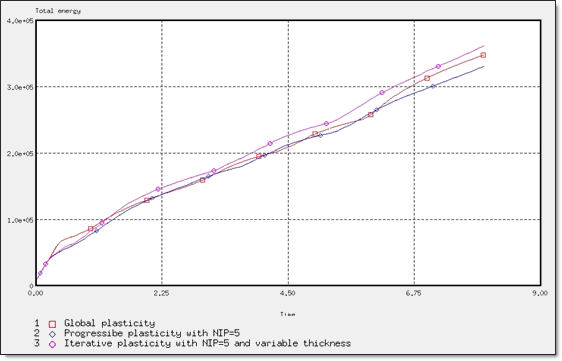
Fig 51: Total energy for different plasticity computations.
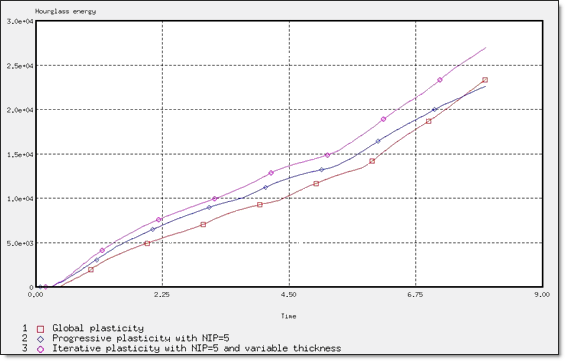
Fig 52: Hourglass energy for different plasticity computations.
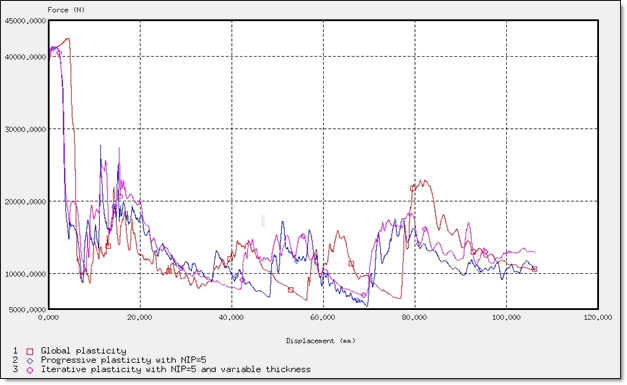
Fig 53: Force for different plasticity computations.