Introduction
Random Response Fatigue analysis is available to study the fatigue life of structures under Random Loading. The setup is similar to a Random Response Analysis setup, with an additional Fatigue subcase. The LCID field on the FATLOAD entry references the subcase ID of the Random Response Analysis subcase.
Power Spectral Density (PSD) results from the Random Response Analysis are used to calculate Moments (mn) that are used to generate the probability density function for the number of cycles vs the stress range.
The PSD Moments are calculated based on the Stress PSD generated from the Random Response Analysis, as shown below.
Input
The following steps are followed to calculate Random Response Fatigue:
Power Spectral Density (PSD) Moments
PSD Moments (mn) are calculated based on the Stress PSD generated from the Random Response Analysis as shown below.
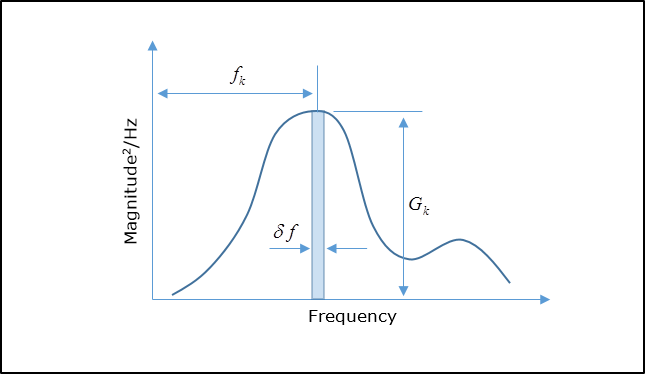
Figure 1: Calculation of PSD Moments
The moments are calculated based on the following equation:
Where,
 is the frequency value.
 is the PSD response value at frequency
  .
.
Probability Density Function (probability density of number of cycles vs stress range)
PSD Moments calculated as shown above are used in the generation of a Probability Density Function  for the stress range. The function is based on the specified damage model on the RDMGMDL continuation line on FATPARM. Currently, DIRLIK, LALANNE, NARROW, and THREE options are available to define the damage model. Multiple damage models are also supported (the worst damage is selected for output from the specified damage models). The default damage model is DIRLIK.
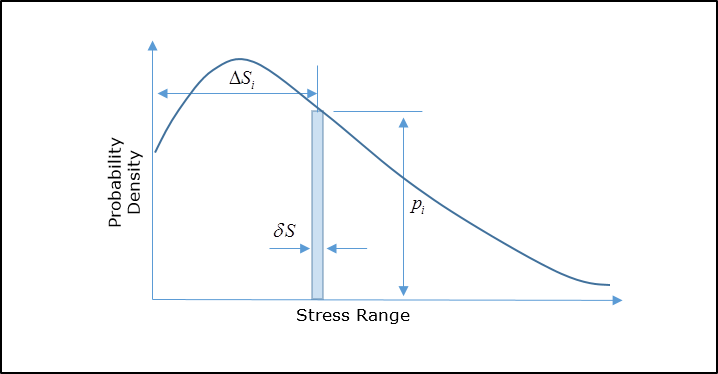
Figure 2: Probability Density Function (probability density of number of cycles vs stress range)
The probability density function can be adjusted based on the following parameters defined on the RANDOM continuation line of FATPARM:
FACSREND: This field is used to calculate the upper limit of the stress range (SREND).
SREND: This field can be used to directly specify the upper limit of the stress range.
NBIN: This field is used to calculate the width of the range ( ) of stress ranges for which the probability is calculated (Figure 2).
DS: This field can be used to directly define the width of the stress ranges ( ).
).
Calculating Probability of occurrence of Stress Range
Calculation of the Probability of occurrence of a stress range between the initial and final stress range values within each bin section are user-defined.
The probability  of a stress range occurring between
  and
and  is
is  .
.
The number of peaks per second in the original time-domain random loading (from which the Frequency based Random PSD load is generated) is determined as follows:
Where,
mn are the corresponding moments, calculated as shown in PSD Moments.
The total number of peaks or cycles is calculated as:
Where, T is the total exposure time given by the TEXP field on the RANDOM continuation line on FATPARM.
The total number of cycles with Stress range  is calculated as:
Fatigue Life (maximum number of cycles of a particular stress range  for the material prior to failure) is calculated based on the Material SN curve as follows:
Total Fatigue Damage as a result of the applied Random Loading is calculated based on:
To account for the mean stress correction with any loading that leads to a mean stress different from zero, you can define a static subcase that consists of such loading (typically gravity loads). This static subcase can be referenced on the STSUBID field of the RANDOM continuation line.


