This section provides an overview of the Graphics entity in MotionView.
Theory/Background
Graphics offer visualization for entities during pre-processing or post-processing. There are two major categories of graphical representation available in MotionView:
When any entity (that can be identified with a location in the model) is added in MotionView, a representative icon associated with the entity is displayed in the graphics area. This is called an Implicit Graphic.
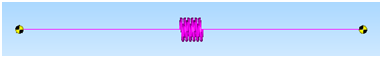
Example Implicit Graphic for Spring Damper Entity
Implicit graphics are only seen during pre-processing of the model and are not exported to the solver deck; hence these graphics are not visible in MotionSolve results. Refer to the Implicit Graphics topic to learn more about controlling the display of these graphics.
|
Explicit Graphics can be used to create a 3D visual display of a model in the graphics window, as well as for displaying an animation following a simulation. These graphics can also used in defining a force entity of the type Contact. Explicit graphics are exported to the solver deck.
Note - A multi body simulation without contact forces does not need graphical entities for the solution.
|
The figure below shows the various types of Explicit Graphics that are available for modeling in MotionView:
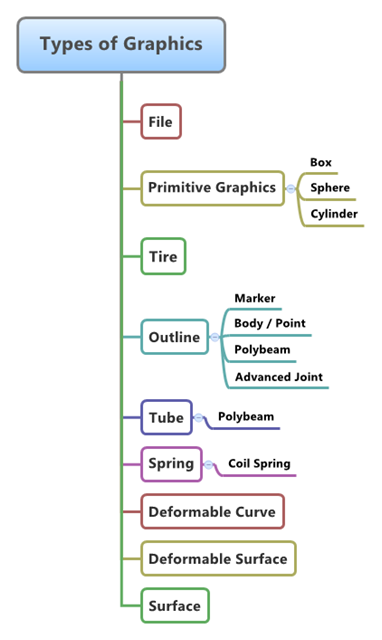
Click on the individual links below to learn more about each specific graphic type, as well as their creation and editing methods:
| • | File - One graphic per component |
Creating/Adding Graphics
To learn how to add an "Entity" to a model, please see the Entity Manual topic.
| 1. | A Graphic entity can be added to the model using two different methods: |
| • | From the Reference Entity toolbar, right-click on the Graphics icon  . . |
OR
| • | From the Project Browser, right-click on the Model label (or on any System/Analysis of your choice) and select Add > Reference Entity > Graphic from the context menu. |
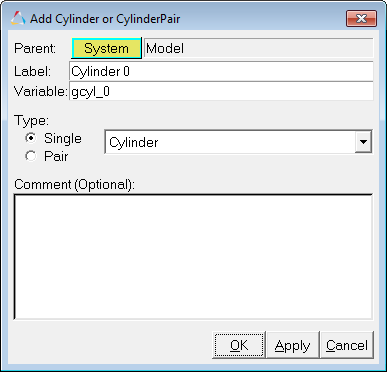
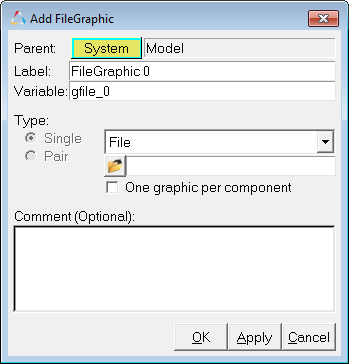
The Add "Graphic" or "GraphicPair" dialog is displayed.
Note - Additional options are available for a File type graphic (see below).
| 2. | From the Type drop-down menu, select one of the following graphic types: File, Box, Sphere, Cylinder, Outline, Tube, Spring, Tire, Deformable Curve, Deformable Surface, Surface, or Graphic System. |
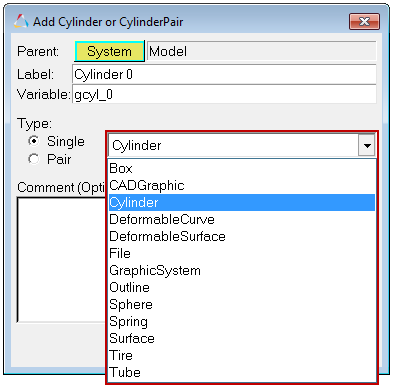
Note - The name of the dialog will automatically update/change to the newly selected graphic type.
| - | If you select File, you can also select One graphic per component. Click the file browser button and select a file from the file browser. |
| 3. | The parent system name is displayed in the System field. |
| 4. | Specify a Label for the graphic (if you want to use a different label than the default). |
The label can be a descriptive name.
| 5. | Specify a Variable for the graphic (if you want to use a different variable name than the default). |
The recommended naming convention for creating graphics is that all graphic variable names should begin with g"type"_. (for example "gsur_" for a Surface graphic). Further, the variable name can be descriptive however it should not contain any special characters (other than ‘underscore’).
| 6. | Click on the entity Type radio button and select the desired graphic type: Single or Pair. |
A Graphic entity, like most of the entities that are created in MotionView, can be a Single Entity or a Pair Entity. Pair entities help in creating models which have symmetric properties.
| 7. | Optionally, you can also specify a descriptive Comment for the graphic. |
| 8. | When you are finished specifying the properties, click OK, Apply, or Cancel. |
| - | Clicking OK will add/create the graphic entity and close the dialog. |
| - | Clicking Cancel will cancel the graphic creation operation and close the dialog. |
| - | Clicking Apply will add/create the graphic; however the dialog will remain open so that more graphics can be added in the same way. |
| 9. | Once a Graphic entity has been added to the model, the panel for the joint will automatically be displayed in the panel area. See the panel example below: |
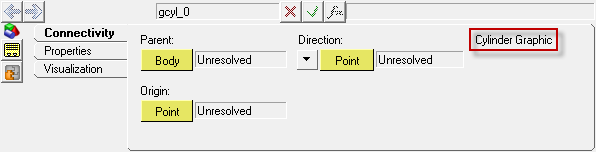
The Connectivity tab displays the type of graphic that was created. Other members/tabs in the panel will vary depending on the type of graphic.
|
Visualization
The display of every graphic in the model can be controlled using the Visualization tab in the Graphics panel.
This Visualization tab is common among all Graphic types (see the example below):
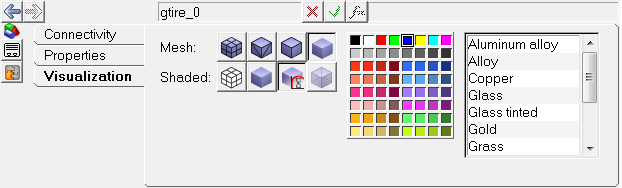
Graphics Visualization Options
The following options allow you to change appearance of a graphic:

|
Mesh Lines
|
Shows all the mesh lines of the H3D Graphic.
|

|
Feature Lines
|
Shows only the prominent feature lines of the H3D Graphic.
|

|
Edge Lines
|
Shows only the edge lines of the H3D Graphic.
|

|
No Lines
|
Hides all the lines on the H3D Graphic.
|
|

|
No Shading
|
Hides all of the shading on the H3D Graphic.
|
|
Opaque
|
Sets the Display mode to Shaded Sets the surface representation of the H3D Graphic to Opaque.
|

|
Use material
|
Sets the transparency as specified in the material. (Applicable when the color is assigned from the material list)
|

|
Transparent
|
Sets the surface representation of the H3D Graphic to Transparent.
|
|
|
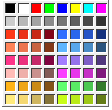
The color palette can be used to change the color of the graphic.
|
|
|
The material list can be used to assign a color that matches with color of a particular type of material.
|
Note - The graphic properties of the materials listed in the material list can be viewed in Graphic Entity Attributes panel. In addition, you can also create a user-defined material type.
|
|
See Also:
Graphic Entity Attributes Panel
Adding and Removing Entities
*Graphic() - cylinder (MDL Model Statement)
*GraphicPair() - cylinder pair (MDL Model Statement)
*DefineGraphic() (MDL Model Statement)
Post_Graphic (XML Command)
InterpretEntity (Tcl Command)
InterpretSet (Tcl Command)


