|
»Click here to display Table of Contents«
|

Evaluate |

|

|

|

|
|
Evaluate |
|
|

|

|
|
»Click here to display Table of Contents«
|
Evaluate |
|
|
|
|
|
Evaluate |
|
|
|
|
In the Evaluate step, approaches are executed and monitored. In a DOE, Fit, or Stochastic approach, the Evaluate step consists of the following tabs:
In an Optimization approach, the Evaluate step, has two additional tabs:
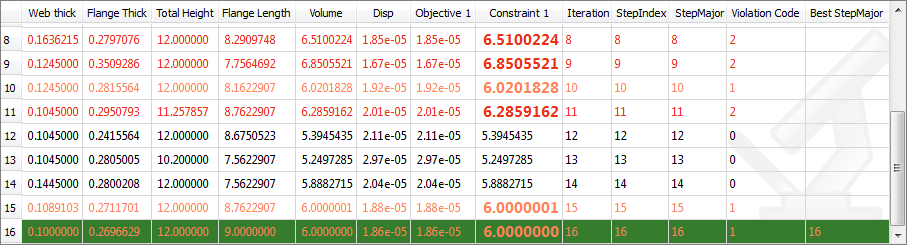
In the Iteration History tab, a report is generated for iterations only; whereas in the Evaluation tab, a report is generated for all of the runs. In comparison to the Evaluation tab, the Iteration History tab displays four additional columns that are present in all optimization studies.
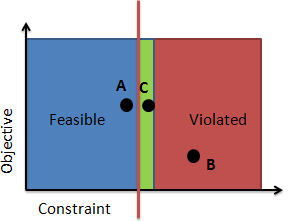
The Iteration History table also uses color coding to help you determine which designs are feasible, optimal, and violated. The following combinations of color coding are available:
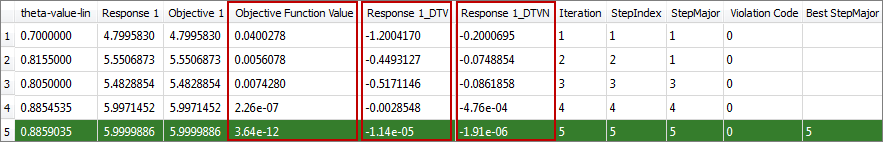
Additional columns are added to the Iteration History table if the objective of your study is system identification or if you are using one of the probabilistic methods. If your objective function is System Identification; the following columns will be added to the Iteration History table:
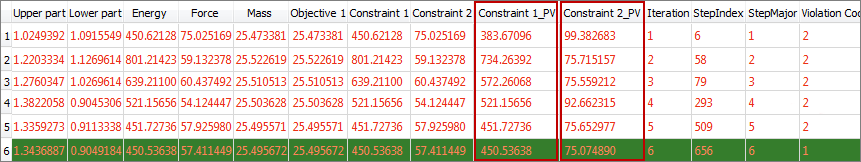
If you are using SORA or SORA_ARSM, a Percentile Value (PV) column will be added to the Iteration History table for each constraint. The PV column displays the value of the constraint that meets the required reliability. Consider a case where a constraint value needs to be less than 75.0 with 98% reliability (constraint 2 below). In the first iteration, SORA finds a design with a constraint value of 75.025, but the PV value for 98% reliability is at 99.383. Hence, this design meets the constraint's upper bound, but does not meet the reliability requirement. In the sixth iteration, SORA finds a design with a constraint value of 57.412 and the PV value for 98% reliability is at 75.075. This design meets the reliability constraint, as 98% of the design will have a constraint value less than 75.075.
|
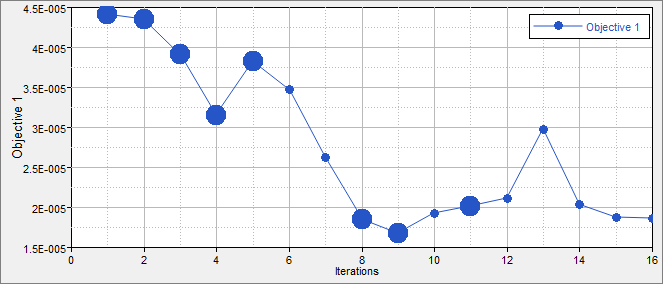
In the Iteration Plot tab, you can plot the iteration history of a study's objectives, constraints, input variables and unused output responses. When the objective history is plotted, infeasible designs are marked with larger markers.
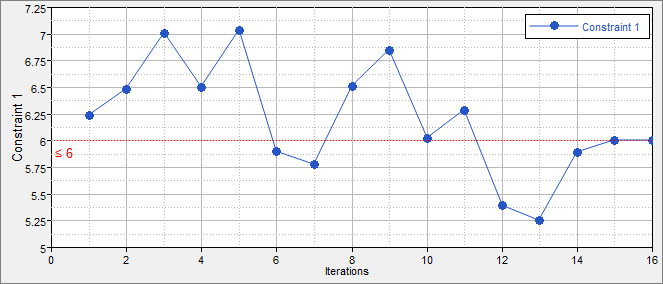
When the constraint history is plotted, the constraint bounds can be marked with a datum line. To activate this feature, click on the Color Wheel and select Bounds.
|
While the evaluation is in progress, it is possible to:
| • | Switch from one tab to another. |
| • | Stop the process by clicking |
See Also: