|
»Click here to display Table of Contents«
|
Scatter
|

|

|

|

|
|
Scatter
|
|
|

|

|
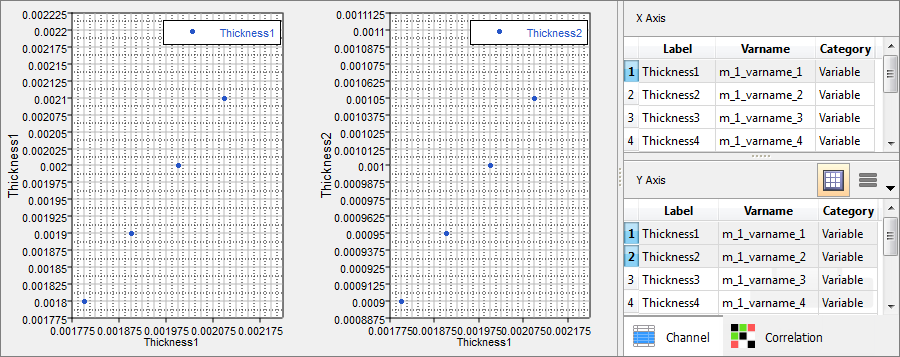
In the Scatter tab, view all input variable and output response data in a scatter plot and correlation map.
Scatter plots illustrate the dependency between a random input variable and an output response or between an output response and an output response. Use the Channel selector to select input variable and/or output response data to plot along the X and Y axes. You can select multiple input variables and/or output responses for the Y Axis.
|
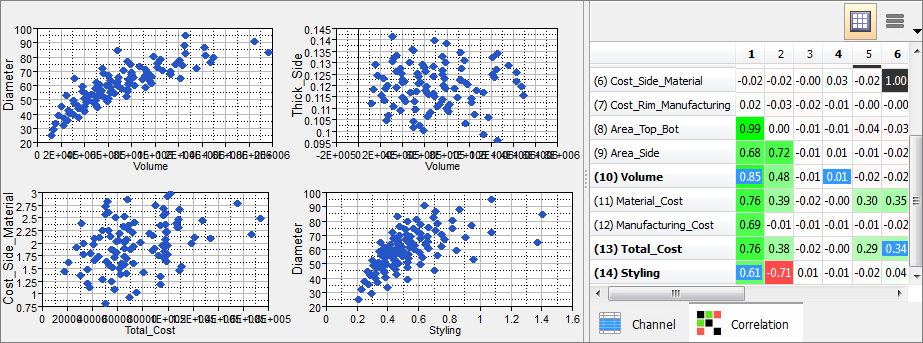
A correlation map displays correlation values. Select one or more cells in the map to display a scatter plot of the selected correlation values. Correlation measures the strength and direction between associated variables. Correlation coefficients can have a value from -1 to 1; -1 indicates a strong but negative correlation and 1 indicates a strong and positive correlation. In the image below, correlations of 0.85, 0.01, 0.34 and -0.71 are plotted.
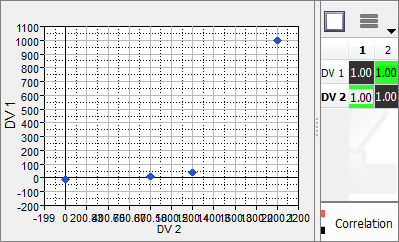
The Pearson product-moment correlation assumes a linear association, and the coefficient values indicate how far away all of the data points are from a line of best fit through the data. The Spearman's rank correlation coefficient assumes a monotonic association, and the coefficient values indicate the degree of similarity between rankings. In the data sets below, the Pearson and Spearman's correlation coefficients are given.
In the image below, Pearson's correlation coefficient is 0.82, as there is a correlation but it is not perfectly linear. Spearman's correlation coefficient is 1.0, as it is perfectly monotonic
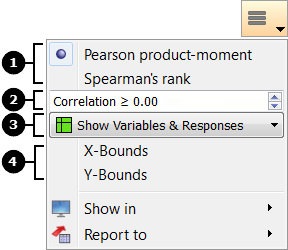
Correlation Map SettingsAccess settings for the Correlation map from the menu that displays when you click
|