Layer Filter |

|

|

|

|
|
Layer Filter |

|

|

|

|
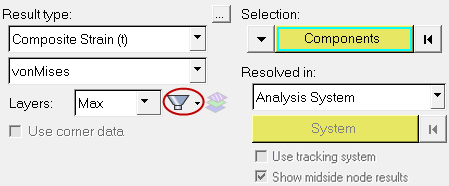
The layer filter reduces the layer list available in the Contour, Iso, Vector, and Tensor panels for the data types that have layers (for example, plies in composite stress/stains or any tensor result with layers). This is important in composites post-processing where different set of layers (plies) belong to different materials, or if different set of layers are oriented in certain directions (0/45/90 degree plies) - and it is of interest to find out the maximum stress or minimum failure index in all the plies oriented in a certain direction, or that are made of particular material.
The filter is enabled whenever a data type with layers is selected.

| Note | The filter will be disabled (or grayed out) if a data type does not contain any layers. |
Once the layer list is filtered (orange highlighting will appear around the filter icon to show that it is turned on), the aggregation of Min/Max/Extreme/Sum/Average/Range can be performed on the reduced list. For example, you can apply the layer filter for plies oriented in a certain direction, and select the Layers aggregate mode of Sum on this reduced ply list to sum up the thickness for that direction of plies.
By default the filter is set to None in the Contour, Iso, Vector, and Tensor panels. To define a custom layer filter, click on the Filter drop-down menu (the downward arrow next to the icon) and select Create/Edit.
The Create/Edit Layer Filters dialog is displayed which lists all pre-defined filters available for editing and their status. The Layers list (located on the right side of the dialog) will display the layers associated with the data type selected in the panel. If no filter has been previously defined, the dialog will be blank.
Clicking Add allows you to create a customized filter by selecting (or deselecting) from the layers available in the Layers list. A minimum of one layer must be selected in order for the filter to be considered valid.
If any of the filters do not have at least one layer/ply selected from the list, then Undefined will be displayed in the Status column (next to the filter name). The following warning message will appear if you attempt to close the dialog with undefined filters displayed in the list:
If only one layer is selected, the Contour and Iso panels will only show that layer without any aggregation modes of Min/Max/Extreme/Sum/Average/Range. If multiple filters are defined, clicking on each filter name in the Filters list will display the layers selected for that filter. Existing filters in the list and layers can also be updated using the Create/Edit Layer Filters dialog. After you are done creating or editing a filter click:
When a filter is applied, the options listed in the Layers drop-down menu in the panel is reduced to whatever layers have been selected for the filter (see the example below):
|
You can access the following options by right-clicking on any filter within the Filters list:
|
All defined filters will be displayed in the Layers filter drop-down (click the arrow next to the Filter icon). A check mark indicates which is the active filter. To set/change the active filter, click the Layer filter drop-down menu and select one of the available options.
|
Any filter can be selected/applied, and the data types can be changed from the Result type drop-down menus in the panels. If the selected data type has layers that match the exact number and labels of the complete list of layers in the filter, then the filter is valid. The available layers displayed in the layer list will be based on the filter. If the changed data type does not match the number and labels of the full list of the layers in the filter, an invalid icon or broken filter icon is shown For example, if a filter has been defined for Ply1, Ply3, Ply5, Ply5 - however the data type selected in the panel is Stress with Z1 and Z2 layers, an invalid filter icon is shown and all of the layers for that data type are displayed:
To make a broken filter valid again, simply change back to the original data type or a new data type that has the same complete list (for example, Composite Stress and Composite Strain), and the normal filter icon is restored. |
Currently, the filters can be only defined from the panels. However, once an active filter is set with a contour/iso/tensor/vector plot applied, it will also reduce the layer list in the Results Browser Layer Selector (based on validity of the filter).
Clicking on valid data types will show the reduced layer list based on the filter set for the contour/iso/tensor/vector plot. For example, if a filter is applied for contour plot on Composite Stress/vonMises, but it is not applied to a tensor plot, then highlighting the data type name (Composite Stress in the Tensor folder of the result folder) will display the full list. However, selecting individual components like XX, YY, P1, etc. will display the filtered list, assuming that the filter is valid. If a plot style with a valid filter definition is applied on data types/components that will invalidate the filter, then the behavior is same as the Filter Validity treatment (the complete list will be displayed). |
The legend of the contour/iso plot will display the name of the filter next to the layer aggregation:
|
|
See Also: