|
»Click here to display Table of Contents«
|

MATFAT |

|

|

|

|
|
MATFAT |
|
|
|

|
|
»Click here to display Table of Contents«
|
MATFAT |
|
|
|
|
|
MATFAT |
|
|
|
|
MATFAT - Fatigue Material Data
Defines material properties for fatigue analysis.
(1) |
(2) |
(3) |
(4) |
(5) |
(6) |
(7) |
(8) |
(9) |
(10) |
MATFAT |
MID |
UNIT |
|
|
|
|
|
|
|
|
STATIC |
YS |
UTS |
|
|
|
|
|
|
Optional continuation lines for SN Fatigue properties:
|
SN |
SR1 |
B1 |
NC1 |
B2 |
FL |
SE |
|
|
|
|
FINDLEY |
TFP |
FKMMSS |
|
|
|
|
|
Optional continuation lines for SN-based Spot Weld Fatigue properties:
|
SPWLD |
|
FKMMSSSP |
|
|
|
|
|
|
|
|
SR1_SP1 |
B1_SP1 |
NC1_SP1 |
B2_SP1 |
FL_SP1 |
SE_SP1 |
|
|
|
|
SR1_SP2 |
B1_SP2 |
NC1_SP2 |
B2_SP2 |
FL_SP2 |
SE_SP2 |
|
|
|
|
SR1_SP3 |
B1_SP3 |
NC1_SP3 |
B2_SP3 |
FL_SP3 |
SE_SP3 |
|
|
Optional continuation lines for SN-based Seam Weld Fatigue properties:
|
SMWLD |
|
FKMMSSSM |
|
|
|
|
|
|
|
|
SR1_SM1 |
B1_SM1 |
NC1_SM1 |
B2_SM1 |
FL_SM1 |
SE_SM1 |
|
|
|
|
SR1_SM2 |
B1_SM2 |
NC1_SM2 |
B2_SM2 |
FL_S\M2 |
SE_SM2 |
|
|
Optional continuation lines for EN Fatigue properties:
|
EN |
Sf |
b |
c |
Ef |
np |
Kp |
Nc |
|
|
|
SEe |
SEp |
|
|
|
|
|
|
|
|
tfp |
gfp |
bg |
cg |
CoefKp90 |
Coefnp90 |
MXLMSTRN |
|
|
|
FSParm |
BMParm |
|
|
|
|
|
|
Optional continuation lines for Factor of Safety (FOS) analysis:
|
FOS |
Tfl |
Hss |
STHETA |
SSHEAR |
|
|
|
|
Field |
Contents |
MID |
Material identification number that matches the identification number on a MAT1 bulk data entry. No default (Integer > 0) |
UNIT |
Defines the units of stress values specified on the YS, UTS, SRI1, FL, Sf, and Kp fields Default = MPa (MPa, PA, PSI, or KSI) |
STATIC |
Indicates that static material properties are defined in the following fields. |
YS |
Yield strength. See comment 1. (Real > 0.0, or blank) |
UTS |
Ultimate tensile strength. See comment 1. (Real > 0.0, or blank) |
SN |
Indicates that fatigue material properties for SN analysis are following. |
SR1 |
Fatigue strength coefficient. It is the stress range intercept of SN curve at 1 cycle in log-log scale. No default (Real > 0.0) |
B1 |
The first fatigue strength exponent. It is the slope of the first segment of SN curve in log-log scale. No default (Real < 0.0) |
NC1 |
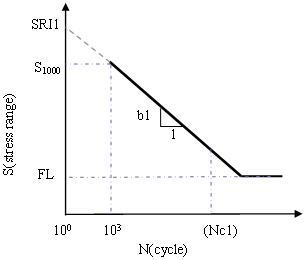
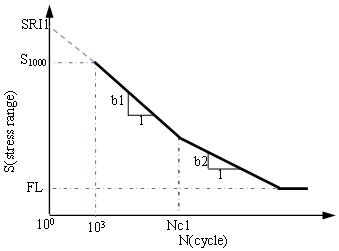
In one-segment S-N curve, this is the cycle limit of endurance (see NC1 in Figure 1). In two-segment S-N curve, this is the transition point (see NC1 in Figure 2). No default (Real > 1000.0) |
B2 |
The second fatigue strength exponent. It is the slope of the second segment of SN curve in log-log scale. Default = 0.0 (Real < 0.0) |
FL |
Fatigue Limit. No damage occurs if the stress range is less than FL (see FL in Figures 1 and 2). See comment 6. (Real > 0.0, or blank) |
SE |
Standard Error of Log(N). Default = 0.0 (Real > 0.0) |
FINDLEY |
Constant k in the Findley model Default = 0.3 (Real > 0.0) |
TFP |
Shear Fatigue Strength coefficient ( Default = Blank (Real > 0.0) |
FKMMSS |
Mean Stress Sensitivity parameter for mean stress correction based on FKM Guidelines. See comment 11. Default = 0.15 (Real > 0.0) |
SPWLD |
Indicates that the fatigue material properties for spot weld fatigue analysis are to follow. |
FKMMSS_SP |
Mean Stress Sensitivity parameter for mean stress correction based on FKM guidelines for spot weld fatigue analysis. See comment 11. Default = 0.15 (Real > 0.0) |
SR1_SPi |
Fatigue strength coefficient. It is the stress range intercept of SN curve at 1 cycle in log-log scale. Here i=1, 2, 3 represent sheet 1, sheet 2, and nugget, respectively in spot weld fatigue analysis. No default (Real > 0.0) |
B1_SPi |
The first fatigue strength exponent. It is the slope of the first segment of SN curve in log-log scale. Here i=1, 2, 3 represent sheet 1, sheet 2, and nugget, respectively in spot weld fatigue analysis. No default (Real < 0.0) |
NC1_SPi |
In one-segment S-N curve, this is the cycle limit of endurance (NC1 in Figure 1). In two-segment S-N curve, this is the transition point (NC1 in Figure 2). Here i=1, 2, 3 represent sheet 1, sheet 2, and nugget, respectively in spot weld fatigue analysis. No default (Real > 1000.0) |
B2_SPi |
The second fatigue strength exponent. It is the slope of the second segment of SN curve in log-log scale. Here i=1, 2, 3 represent sheet 1, sheet 2, and nugget, respectively in spot weld fatigue analysis. Default = 0.0 (Real < 0.0 ) |
FL_SPi |
Fatigue Limit. No damage occurs if the stress range is less than FL (FL in Figures 1 and 2). See comment 6. Here i=1, 2, 3 represent sheet 1, sheet 2, and nugget, respectively in spot weld fatigue analysis. (Real > 0.0, or blank) |
SE_SPi |
Standard Error of Log(N). Here i=1, 2, 3 represent sheet 1, sheet 2, and nugget, respectively in spot weld fatigue analysis. Default = 0.0 (Real > 0.0) |
SMWLD |
Indicates that the fatigue material properties for seam weld fatigue analysis are to follow. |
FKMMSS_SM |
Mean Stress Sensitivity parameter for mean stress correction based on FKM guidelines for seam weld fatigue analysis. See comment 11. Default = value defined in FKMMSS field (Real > 0.0) |
SR1_SMi |
Fatigue strength coefficient. It is the stress range intercept of SN curve at 1 cycle in log-log scale. Here i=1, 2 represent bending SN and membrane SN respectively in seam weld fatigue analysis. No default (Real > 0.0) |
B1_SMi |
The first fatigue strength exponent. It is the slope of the first segment of SN curve in log-log scale. Here i=1, 2 represent bending SN and membrane SN respectively in seam weld fatigue analysis. No default (Real < 0.0) |
NC1_SMi |
In one-segment S-N curve, this is the cycle limit of endurance (NC1 in Figure 1). In two-segment S-N curve, this is the transition point (NC1 in Figure 2). Here i=1, 2 represent bending SN and membrane SN respectively in seam weld fatigue analysis. No default (Real > 1000.0) |
B2_SMi |
The second fatigue strength exponent. It is the slope of the second segment of SN curve in log-log scale. Here i=1, 2 represent bending SN and membrane SN respectively in seam weld fatigue analysis. Default = 0.0 (Real < 0.0 ) |
FL_SMi |
Fatigue Limit. No damage occurs if the stress range is less than FL (FL in Figures 1 and 2). See comment 6. Here i=1, 2 represent bending SN and membrane SN respectively in seam weld fatigue analysis. (Real > 0.0, or blank) |
SE_SMi |
Standard Error of Log(N). Here i=1, 2 represent bending SN and membrane SN respectively in seam weld fatigue analysis. Default = 0.0 (Real > 0.0) |
EN |
Indicates that fatigue material properties for EN analysis are following. |
Sf |
Fatigue strength coefficient. No default (Real > 0.0) |
b |
Fatigue strength exponent. No default (Real < 0.0) |
c |
Fatigue ductility exponent. No default (Real < 0.0) |
Ef |
Fatigue ductility coefficient. No default (Real > 0.0) |
np |
Cyclic strain-hardening exponent. No default (Real > 0.0) |
Kp |
Cyclic strength coefficient. No default (Real > 0.0) |
Nc |
Reversal limit of endurance. One cycle contains two reversals. See comment 6. Default = 2.0E8 (Real > 1.0E5) |
SEe |
Standard Error of Log(N) from elastic strain. Default = 0.0 (Real > 0.0) |
SEp |
Standard Error of Log(N) from plastic strain. Default = 0.0 (Real > 0.0) |
tfp |
Shear Fatigue Strength coefficient ( Default = Blank (Real > 0.0) |
gfp |
Shear Fatigue Ductility coefficient ( Default = Blank (Real > 0.0) |
bg |
Shear Fatigue Strength exponent (br) Default = b (Real < 0.0) |
cg |
Shear Fatigue Ductility exponent (cr) Default = c (Real < 0.0) |
CoefKp90 |
Coefficient value (see Plasticity model for strain-based fatigue analysis in the User's Guide) Default = 1.2 (Real > 0.0) |
Coefnp90 |
Coefficient value (see Plasticity model for strain-based fatigue analysis in the User's Guide) Default = 1.0 (Real > 0.0) |
MXLMSTRN |
Maximum Strain value for Strain-Life Approach in Multiaxial Fatigue Analysis. The default value is 0.02 (corresponds to 2% strain). This value is used in the plasticity model regardless of whether the load is proportional or non-proportional. Default = 0.02 (Real > 0.0) |
FSParm |
Constant k for the Fatemi-Socie model Default = 0.3 (Real > 0.0) |
BMParm |
Constant S for the Brown-Miller model Default = 1.0 (Real > 0.0) |
FOS |
Indicates that material properties for factor of safety analysis are defined in the following fields. |
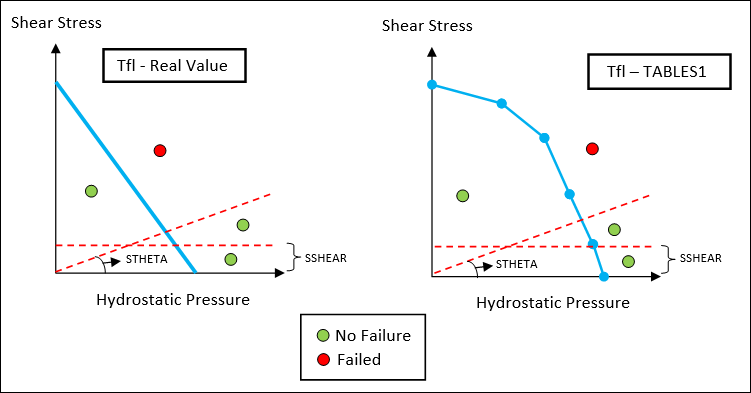
Tfl |
Torsion fatigue limit. A Real or Integer value can be specified. If an integer is input, then it references the ID of a TABLES1 Bulk Data Entry that defines the intersection points. The X-values represent Hydrostatic Pressure, and Y-values represent Shear. See comment 10. No default (Real > 0.0 or Integer) |
Hss |
Hydrostatic stress sensitivity. No default (Real > 0.0) |
STHETA |
Safe zone angle. If the angle of a point in the domain is lower than the Safe zone angle, it is considered safe (FOS is 1.0e20). See comment 10. Default = 0.0 (Real ≥ 0.0) |
SSHEAR |
Shear Threshold for the Safe zone. If the microscopic shear stress is lower than this value, it is considered safe (FOS is 1.0e20). See comment 10. Default = 0.0 (Real ≥ 0.0) |
|
|
Figure 1a: One-segment S-N curve in log-log scale (b2=0) |
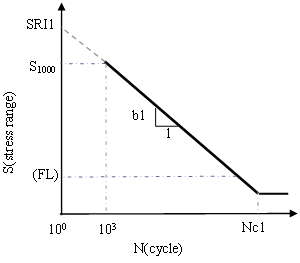
Figure 1b: One-segment S-N curve in log-log scale (b2=0) |
|
|
Figure 2: Two-segment S-N curve in log-log scale |
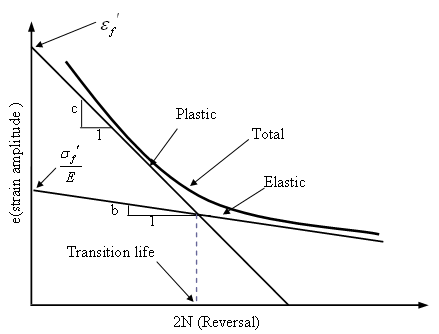
Figure 3: E-N curve in log-log scale
| 1. | UTS or YS is used in mean stress correction (SN) and surface finish correction (SN and EN). If both UTS and YS are defined, UTS will be used. It is not allowed that both UTS and YS are blanks. |
| 2. | S-N data defined in the MATFAT card is expected to be obtained from standard experiments that are fully reversed bending on mirror-polished specimens. |
| 3. | S-N curves are defined in Stress range – Cycle form. Stress range is the algebraic difference between the maximum and minimum stress in a cycle. SN curve is expressed as: |
![]()
Where Sr is the stress range, SRI1 is the fatigue strength coefficient, Nf is the cycle number, and b is the fatigue strength exponent.
| 4. | E-N curves are defined in Strain amplitude - Reversal form. Strain amplitude is half of the algebraic difference between the maximum and minimum strain in a cycle, and one strain cycle contains two reversals. EN curve is expressed as: |
![]()
Where, ![]() is the strain amplitude,
is the strain amplitude, ![]() is the fatigue strength coefficient, E is the Young's modulus, Nf is the cycle number, b is the fatigue strength exponent,
is the fatigue strength coefficient, E is the Young's modulus, Nf is the cycle number, b is the fatigue strength exponent, ![]() is the fatigue ductility coefficient, and c is the fatigue ductility exponent.
is the fatigue ductility coefficient, and c is the fatigue ductility exponent.
| 5. | Empirical formula can be used to estimate SN/EN data from ultimate tensile strength (UTS) and Young’s modulus (E): |
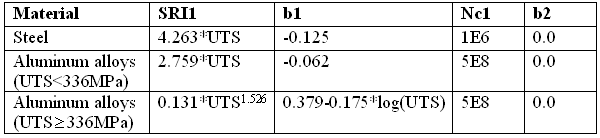
Table 1* Estimated S-N data from empirical formula
(* Source: Yung-Li Lee, Jwo. Pan, Richard B. Hathaway and Mark E. Barekey. Fatigue testing and analysis: Theory and practice, Elsevier, 2005)
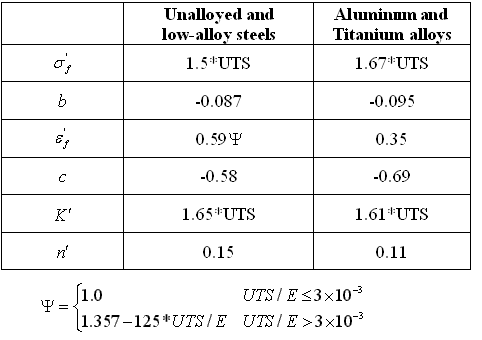
Table 2**. Estimate E-N data from UTS and E
(** Source: Anton Baumel and T. Seeger, Materials Data for Cyclic Loading, Elsevier, 1990)
| 6. | For one-segment SN curve (b2=0.0), if FL is blank, the fatigue limit is the stress range at Nc1. If both Nc1 and FL are defined, the more conservative value (larger damage) will be used (Figure 1). |
For two-segment SN curve, if FL is blank, the fatigue limit is 0.0.
When fatigue optimization is performed, fatigue limit FL of S-N data and reversal limit Nc of E-N data will be ignored in order to get continuous changes in fatigue results when stress/strain changes.
| 7. | If tfp or gfp are not available, OptiStruct calculates this automatically. See Fatemi-Socie model in the User's Guide. |
| 8. | Although tfp is defined in EN, it can be used both in EN (FS model) and SN (Findley). TFP should be defined based on the amplitude. |
| 9. | If tfp is not defined for SN, OptiStruct calculates this automatically. See Findley model in Fatigue in the User's Guide. |
| 10. | The Tfl field can be used to define either a value (constant slope) or a table (multiple slopes) to specify the Failure zone. Additionally STHETA and SSHEAR fields can be used to determine safe-zones for FOS calculation. |
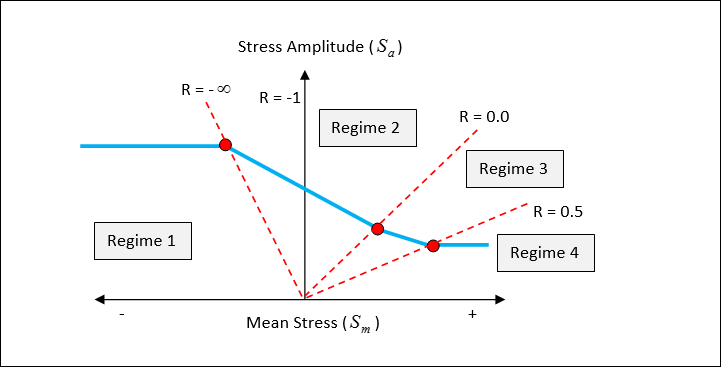
| 11. | The FKMMSS field can be used to define a Mean Stress Sensitivity (M) value for Mean Stress Correction when accurate experimental data is not available. Based on FKM-Guidelines, the Haigh diagram is divided into four regimes based on the Stress ratio (R=Smin/Smax) values. The Corrected value is then used to choose the S-N curve for the damage and life calculation stage. |
Regime 1 and Regime 4: Mean stress correction is not applied (M=0.0)
Regime 2: Se = Sa + M * Sm
Regime 3: 
Where, Se is the fully reversed fatigue strength (Endurance stress), Sm is the mean stress, and Sa is the stress amplitude.
| 12. | This card is represented as a material in HyperMesh. |
See Also: