HyperView User's Guide

Free Body Diagrams (FBD)

Free Body Diagrams (FBD)

Previous topic Next topic Expand/collapse all hidden text  

Free Body Diagrams (FBD)

Previous topic Next topic JavaScript is required for expanding text JavaScript is required for the print function  

Overview

You can create or edit Free Body Diagrams (FBD) using the FBD utility that is provided in HyperView.  The Free Body Diagram (FBD) utility facilitates the extraction and post-processing of Grid Point Force (GPFORCE) results.  FBD extractions are typically utilized for breakout and/or sub-modeling analysis schemes, where balanced "free body" sub-cases are extracted from a coarse grid model and applied to a fine grid sub-model for eventual optimization and/or analysis.  FBD is also used to extract section resultant forces and moments (typically at the centroid of a section) for use in traditional strength calculations.
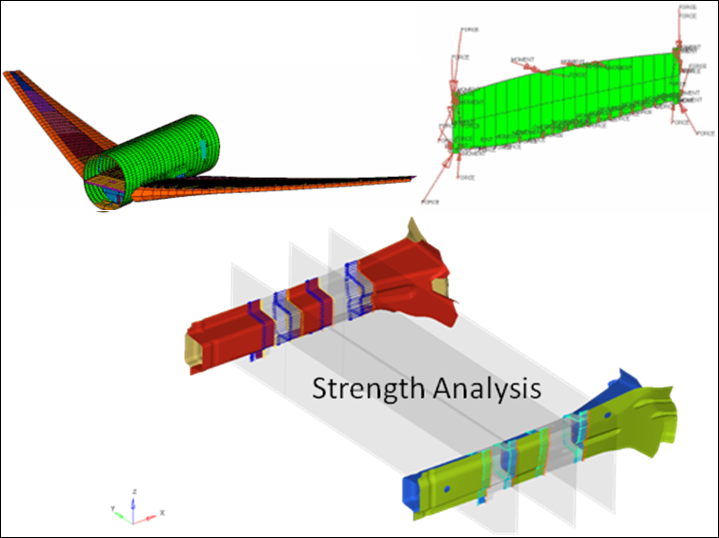
fbd_forces_grid_model_example_hv

FBD Utility

The FBD utility extracts grid point force (GPFORCE) data (including forces and moments) for a user-defined element set, and is useful for doing breakout modeling within a sub-modeling scheme. Results can be output for graphical review, a text summary table, and/or a formatted Comma-Separated Values (.csv) file which can be loaded into traditional spreadsheet software packages.

The data from the currently loaded model/results file and the selected load case/simulation in the Results browser will be used for all grid point force based calculations.  The FBD utility currently supports Ansys (Rst), Nastran (Op2/XDB), Optistruct (Op2), and H3D result files.

Important Note - The Advanced Result Math template must be selected when loading the model and result files in the Load Model panel.

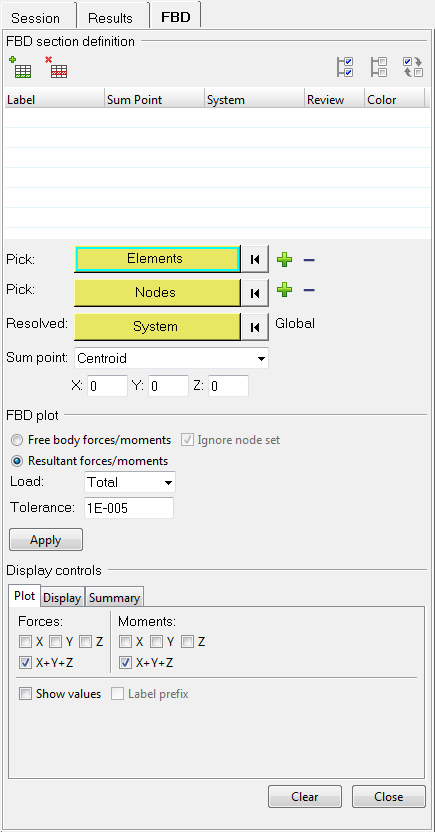
The FBD utility is displayed in the tab area, which opens when you activate that tool by clicking the FBD icon fbd_utility_icon_hv on the Results toolbar.

fbd_forces_tab_hv

The FBD Forces utility is broken down into three major sections, each of which corresponds with the process order of using the tool:

FBD section definition

Element based sections are defined and modified in this first step of the process.  You can define multiple sections, associate elements, associate a node group (optional for resultant summation), or define other attributes (like a summation point, a coordinate system, etc.).

FBD plot

Once the sections are defined, you can plot results (Freebody or Resultant Forces/Moments) in this middle step of the process.

Display controls

The presentation of the results/plots are controlled in this final step of the process.  The various controls allow you to determine how the vectors are drawn in the graphics area, view the results in a summary table, or export/save the results to a .csv or .fbd file.

Click on each section below to learn more:

hmtoggle_plus1FBD section definition

The FBD section definition portion of the tab allows you to create and manage the section definitions that are used for plotting the free body or resultant forces.  This section contains tools for manually defining sections, which are defined by an element set, node set, summation node, and a local result coordinate system.

fbd_forces_fbd_section_def_hv

fbd_forces_add_new_section_icon_hvAdd new section

Click this icon to add new section to the table.

Whenever a new section is added, a warning icon fbd_forces_caution_icon_hv will also be displayed in the table which indicates that it has not yet been defined.  Once Elements have been picked, a green check mark will be displayed indicating that the section has now been defined.

fbd_forces_delete_selected_section_icon_hvDelete selected section

Click this icon to remove the selected section from the table.

hv_mb_select_all_icon Select all sections

Click this icon to select all of the sections in the table/list.

hv_mb_deselect_all_icon Deselect all sections

Click this icon to deselect all of the sections in the table/list.

hv_mb_reverse_selection_icon Reverse selected sections

Click this icon to reverse the status of the currently selected/deselected sections in the table/list.

Section table/list

The Section table/list lets you specify the sections from which you wish to calculate resultant force and moment results for each selected loadstep.

fbd_forces_blank_table_hv

The section table/list contains the following headers and column information:


Label

The label for the section.


Sum point

The selected summation node about which the grid point data is being summed.


System

The specified coordinate system into which the grid point vector results are being transformed and output.


Review

Activate this check box to highlight the currently selected element/node section, summation point, and result system in the graphics area.  This allows you to verify a section definition.


Color

Select/change the review color of the  section using the color box and palette.


The sections in the table/list can be sorted by clicking on the heading of each column (for example, click the Label heading to sort alphabetically by name).  Repeated clicks on the column heading will toggle between ascending and descending order.

Standard CTRL/SHIFT-click functionality can also be used to select multiple sections in the table/list.

In addition, you can access the following context menu options by right-clicking anywhere within the table/list:

Show - Displays the selected section(s) in the graphics area and leaves the corresponding Review check box(es) state unaltered.
Hide - Hides the selected section(s) in the graphics area and deactivates the corresponding Review check box(es).
Isolate - Displays only the entities in the selected section, unchanging the state of the corresponding Review check box(es), while also turning off all other entities of the same type and their corresponding Review check box(es).
Select All - Selects all of the sections in the table/list.

Pick (Elements)

Select the elements that make up the free body and contain the nodes at which grid point data will be extracted for the section using either of the following methods:

Pick individual elements directly from the screen.

OR

Pick multiple elements directly from the screen using the quick window selection.

OR

Click the Elements input collector and use the extended entity selection menu.

See Selecting Entities Using the Input Collector for more information on selecting entities.


plus_icon_fbd_hv

Click the plus icon (located next to the input collector) to add elements to the selected section.


minus_icon_fbd_hv

Click the minus icon (located next to the input collector) to remove elements from the selected section.

Pick (Nodes)

Select the nodes that define the section using either of the following methods:

Pick individual nodes directly from the screen

OR

Pick multiple nodes directly from the screen using the quick window selection

OR

Click the Nodes input collector and use the extended entity selection menu.

See Selecting Entities Using the Input Collector for more information on selecting entities.

Only the nodes contained within the selected node section will be part of the grid point extraction.


plus_icon_fbd_hv

Click the plus icon (located next to the input collector) to add nodes to the selected section.


minus_icon_fbd_hv

Click the minus icon (located next to the input collector) to remove nodes from the selected section.

Resolved (System)

Specify the coordinate system into which the grid point vector results will be transformed and output for the section using either of the following methods:

Pick the system directly from the screen.

OR

Click the System input collector and using the extended entity selection menu.

See Selecting Entities Using the Input Collector for more information on selecting entities.

Note - If a results system is not specified, the HyperView "base" system is used by default.

Sum point

Define the node about which the grid point data is to be summed for the section. This is useful for verifying free body behavior through zero-sum values for all force and moment components about any node.  It is also useful for calculating the result of applied or reaction forces about any node.  If a node is not selected, the HyperView origin (0,0,0) is used by default.  A dot is drawn for the summation point.

Use the drop-down menu to select one of the following options:


Centroid

This default option calculates the nodal averaged centroid of the coordinates of all of the nodes in the section.


Node

Displays a Node input collector which is used to pick the summation point (using the By ID method).


Coordinate

Displays X, Y, and Z coordinate fields which are used to specify the summation point.

hmtoggle_plus1FBD plot

The FBD plot portion of the tab contains various options to review and display the results of both Free Body Force and Moment and Resultant Force and Moment extractions.

fbd_forces_fbd_plot_section_hv

Free body forces/moments

Select this option to display the freebody forces/moments on the sections.  Depending on the Load component selected, the free body forces represent the forces acting on each of the nodes in the section.  Free body forces/moments plots are used to understand the loads acting on a portion of a model (the section), as exerted by the rest of the structure.

Free body diagrams are used to understand the load transfer points.  The extracted free body forces are also used for sub-modeling a portion of the model with a more detailed analysis.


Ignore node set

Activate this check box to ignore all nodes sets in the section when calculating the free body forces.

A section can be used for the dual purpose of obtaining free body forces or a resultant.  For a section that is in equilibrium, the resultant forces of all the nodes in that section is zero.  A node set is typically defined for obtaining the resultant on one side of a section.  The FBD plot can show free body forces on the entire section, or only on the selected nodes of the node set.

Resultant forces/moments

Select this option to calculate resultant forces/moments on the section.  For the entire section in equilibrium, the resultant will be summed to zero.  Assign a node set to sum up forces only for specific nodes.

This option can also be used to generate input data for shear and moment (VMT) diagrams and/or to perform load-case screening with Potato plots in HyperView.  Two utilities available within HyperGraph also interact with data generated from the Resultant Force and Moment utility.

Load

Use the drop-down menu to determine the grid point force and moment data to extract and utilize for FBD calculations for each node in the selected element.  The following options are available:


Total

Extracts and utilizes all element contribution, applied, SPC, and supported MPC grid point data for FBD calculations on the nodes in the selected element set.


Applied

Extracts and utilizes only the applied loads grid point data for FBD calculations on the nodes in the selected element set.


Reaction

Extracts and utilizes only SPC and supported MPC grid point data for FBD calculations on nodes in the selected set.

MPC force and moment data are properly extracted for the following MPC constraint types: RBE2, RBE3, Rigidlink, RJOINT, RROD, and RBAR.

Tolerance

Use the entry field to define the cut-off point below which a result quantity is considered zero.

All calculations are performed with floating point precision and the zero tolerance value is only used to control the output of results to the various formats.  This option helps to prevent relatively small values from being output to the result formats.

To maintain floating-point precision the default is set to 1E-005; modify the value as desired.

Apply

Click Apply to extract the specified grid point data and display it for visualization in the graphics area.

hmtoggle_plus1Display controls

The Display controls portion of the tab contains sub-tabs which allow you to control the presentation of the results/plot.

fbd_forces_display_controls_section_hv

The following sub-tabs are available:

The Plot sub-tab allows you to create a vector plot and turn on/off the display of various attributes.  

fbd_forces_plot_tab_hv

Forces

Activate the X, Y, Z, or X+Y+Z (default) coordinate check box(es) to display the corresponding axis (or axes) for forces.

Moments

Activate the X, Y, Z, or X+Y+Z (default) coordinate check box(es) to display the corresponding axis (or axes) for moments.

Show values

Activate the check box to display the values at the tip of the vector.

Label prefix

Activate the check box to display the label prefix of the vector.

The Display tab allows you to change how the vectors are displayed for the created plot.

fbd_forces_display_tab_hv

Size scaling

Use the drop-down menu to scale the vector size:


Auto

Automatically scales the vector length (the average vector length will be approximately 2% of the model size).  This is set as the default scale mode.


By
Magnitude

The vector size is displayed relative to the value of the vectors. The Scale value field allows you to increase or decrease the size according to a scaling value.


Uniform

All vectors are displayed in a uniform size.  You can increase or decrease the size using the Scale value field.

Color

Allows you to change the colors for individual forces or moments (Fx, Fy, Fz, Fr, Mx, My, Mz, or Mr).  To change a color: click the color box to display the color palette, then select a different color from the palette.

Vector heads

The first drop-down menu allows you to display the vector head as an arrow or a straight line:


Arrow

Displays the vector head as an arrow.


None

Displays the vector head as a straight line.


The second drop-down menu allows you to attach the tail, tip, or center of the vector head to the reference point:


Tail

Attaches the tail of the vector head to the reference point.


Tip

Attaches the tip of the vector head to the reference point.


Center

Attaches the center of the vector head to the reference point.

Numeric format

Use the drop-down menu to define the setting for numerical presentation of the vector plots:


Scientific

Displays the values in scientific format.

The value field allows you to increment the current value from 1 to 10 decimal points.


Fixed

Displays the values in a fixed format.

The value field allows you to increment the current value from 1 to 10 decimal points.

Sum point size

Use the value field to specify the size of the summation point.

The Summary tab allows you to select load cases for display in a summary table.

fbd_forces_summary_tab_hv

The load case list can be sorted by clicking on any of the column headers (Id and Label).

Select the load case(s) to be included in the summary table by activating the check box for the desired load case(s).  Or click the check box in the column header to select all of the available load cases.

Click the FBD summary table icon fbd_forces_fbd_summary_table_icon_hv (located in the lower right corner of the tab) to output the results to a pop-up dialog for instant review.  The table contains information about the load cases, element/node sections, and detailed data from the grid point extraction at each node.  A sample window with partial output is shown below:

fbd_forces_fbd_summary_table_hv

The FBD summary table dialog displays a hierarchical view of the information contained in the FDB tab, grouped together in a table by section and subcase.

The table can be sorted by clicking on any of the column headers (Section, Subcase, Simulation, Load, System, Node, X, Y, Z, Fx, Fy, Fz, Mx, My, Mz, Fr, Mr).  The sorting method will depend on the type of table that is currently selected.

To select/change the table type, click the drop-down menu fbd_forces_table_type_drop_down_menu_icon_hv and select one of the following options:

The Resultant table displays the information grouped by section/block:

fbd_forces_fbd_sum_table_dialog_sum_table_view_hv

Click the plus icon plus_icon_small_fbd_hv in the Section column to expand and view the information for each subcase.

Column header sorting will sort the information for each subcase individually.


The FBD table displays the information in a flat list (without any grouping by section):

fbd_forces_fbd_sum_table_dialog_fbd_table_view_hv

Column header sorting will sort the information for the entire list.


The Summary table only displays the information for the top level summary rows:

fbd_forces_fbd_sum_table_dialog_resultant_table_view_hv

Column header sorting will sort the information for only the summary rows.


This FBD summary table dialog also includes options that allow you to export the plot as a .csv file (which can be loaded into traditional spreadsheet software packages) or save it to an .fbd file (to be imported into HyperGraph).

To export/save the plot, click the Save as drop-down menu fbd_forces_save_as_type_drop_down_menu_icon_hv and select one of the following options:

Creates or saves a .csv file containing the same information as the summary table, but in a comma separated file.  Use the Export CSV file dialog to create a new file or select an existing file.

fbd_forces_export_csv_file_dialog_hv

Note - If an existing file is selected, you will be asked if you wish to replace the existing file.

Creates or saves an .fbd file that can be read into HyperGraph.  Use the Export CSV file dialog to create a new file or select an existing file.

fbd_forces_export_fbd_file_dialog_hv

Note - If an existing file is selected, you will be asked if you wish to replace the existing file.

Two utilities available within HyperGraph interact with data generated from the FBD utility: Shear and Moment Plot (VMT Plots) and Potato Plot.  These utilities are accessed from the Free Body Diagrams item within the HyperGraph Utilities menu.

Click the following buttons located at the bottom of the tab to clear the current plot or close/exit the dialog:

Clear - Clears the current plot for the selected set in the graphics area.  The dialog will remain open.
Close - Closes/exits the dialog.  All current plots will remain displayed in the graphics area (until they are cleared using the Clear button).

FBD Solver Interfacing

The Free Body Diagram utility will behave differently depending on the solver that you interface with in HyperView.  Click below to learn more about each of the supported solvers:

hmtoggle_plus1Ansys
Currently only supported for Win32 and Win64 platforms.
Results are supported through the .rst output file.
Grid Point Forces (GPF) results are requested with the following .rst file output requests:

OUTRES,ALL,ALL

OR

OUTRES,NSOL,ALL

OUTRES,RSOL,ALL

Displacement results are requested with the following .rst file output requests:

OUTRES,ALL,ALL

OR

OUTRES,NSOL,ALL

OUTRES,RSOL,ALL

hmtoggle_plus1Nastran
Results are supported through the .op2 output file.
Grid Point Forces (GPF) results are requested with the GPFORCE .op2 output request.
Displacement results are requested with the DISPLACEMENT .op2 output request.
It is recommended practice to output data for only the node set(s) of interest.  This procedure reduces the size of the solver results file and helps speed up the FBD extractions.  Consider using STRESS=NONE and STRAIN=NONE to further reduce the size of the results file.
MPC forces and moments are properly extracted for the following MPC constraint types:

RBE2

RBE3

RigidLink

RJOINT

RROD

RBAR

hmtoggle_plus1OptiStruct
Results are supported through the .op2 output file.
Grid Point Forces (GPF) results are requested with the GPFORCE .op2 output request.
Displacement results are requested with the DISPLACEMENT .op2 output request.
It is recommended practice to output data for only the node set(s) of interest.  This procedure reduces the size of the solver results file and helps speed up the FBD extractions.  Consider using STRESS=NONE and STRAIN=NONE to further reduce the size of the results file.  You may consider using the NOMODEL option on the OUTPUT,OP2 output format request.
MPC forces and moments are properly extracted for the following MPC constraint types:

RBE2

RBE3

RigidLink

RJOINT

RROD

RBAR

hmtoggle_plus1H3D
H3D files created using Hvtrans from Nastran/Optistruct Op2 output files will be supported provided the OP2 contains the appropriate result types.
H3D allows you to combine several Op2 results files (each file representing a particular loadcase on the same model) into a single file and perform FBD extractions on all loadcases.
For details on the outputs the Op2 file should contain, please refer to the Nastran and OptiStruct sections above.