|
»Click here to display Table of Contents«
|

Curve Graphic |

|

|

|

|
|
Curve Graphic |
|
|
|

|
|
»Click here to display Table of Contents«
|
Curve Graphic |
|
|
|
|
|
Curve Graphic |
|
|
|
|
The Curve Graphic panel helps to create/modify a geometrical curve entity in 3D Cartesian space. A curve graphic is created by positioning a 3D curve entity (Cartesian or Parametric Curve) in a reference frame (marker).
The reference frame can be an explicit marker or can be implicitly defined using a Body-Point-Orientation method.
Location: Graphics panel - Connectivity tab
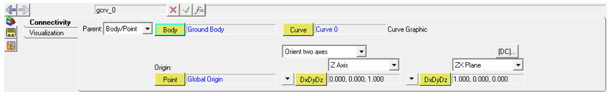
Graphics panel – Connectivity tab for a curve graphic
Parent |
Select the method of specifying a reference frame:
|
|||||
|
Marker |
Select an existing marker in the model to position the curve graphic. The curve will belong to the marker’s parent body. |
||||
|
Body/Point |
If this option is chosen as a parent, select the body to which the curve would belong. Select a Point entity as the origin for the reference frame (implicit marker) to be created. |
||||
Curve |
The 3D Cartesian Curve associated with the graphic. |
|||||
Select the method of orientation for the implicit marker. |
||||||
X|Y|Z Axis |
Select any one axis for orientation of the curve graphic. |
|||||
|
Point Vector DxDyDz |
Point aligns the axis to a point. Vector aligns the axis along a vector. DxDyDz aligns the axis along explicit vector components. |
||||
XY|XZ|YX|YZ|ZX|ZY Plane |
Select the plane for orienting the second axis of the marker. Only two choices will be available based on the axis selected previously. For example if Z Axis is selected, then the ZX and ZY plane will be available. Refer to the Methods of Orientation topic to better understand how the Axis and Plane method of orientation works. |
|||||
|
Point Vector DxDyDz |
Point aligns the axis to a point. Vector aligns the axis along a vector. DxDyDz aligns the axis along explicit vector components. |
||||
Allows you to view the direction cosines’ matrix for a coordinate system. |
||||||
Comments
| • | The curve graphic is created using the X,Y, and Z data provided in the 3D Curve (Cartesian or Parametric) with respect to the selected reference frame. |
| • | This curve graphic can be used to define 2D Rigid to Rigid Contact or higher pair constraints such as Point to Curve or Curve to Curve constraint. |
See Also: