HyperMath functions are directly supported by HyperWorks Desktop and HyperStudy, making the registered HyperMath functions accessible in those products.
This tutorial demonstrates how to register and use custom functions within HyperGraph.
Step 1: Create and save the function in a file.
| 2. | In a new script, type the following code. The function, which computes a new vector with each entry averaged with its neighboring entries, takes two arguments: and input data vector and the number of points to average in the positive and negative direction. |
function runningAverage(x,m)
//x - data vector
//y - forward/backward enties to average
nn = Length(x)
x_f = Zeros(Size(x))
for ix = 1,nn do
total = x(ix)
denom = 1
for jx=1,m do
plus = ix + jx
minus = ix - jx
if ( minus >= 1 ) then
total = total + x(minus)
denom = denom + 1
end
if ( plus <= nn ) then
total = total + x(plus)
denom = denom + 1
end
end
x_f(ix) = total/denom
end
return x_f
end
Step 2: Register the function for use in HyperGraph.
| 1. | After making sure the script has been saved, highlight the function name runningAverage. Right-click on the highlighted text and select Register with HG …. A new window is shown that lists all the functions registered with HyperGraph, as shown in the image below. Click OK to close the window and the registration process is complete. HyperMath can be closed (optional). |

Step 3: Use the function in HyperGraph.
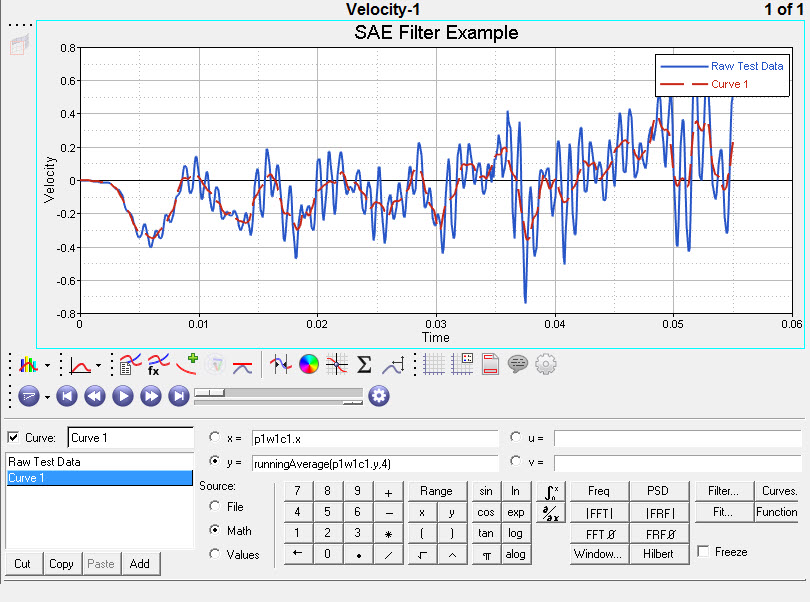
| 1. | Open HyperGraph and load the session file hg_session.mvw. A plot of raw time history data is plotted in the HyperGraph window; the running average function is applied to this data. From the Define Curves panel, click Add to add a new curve to the window. Under Source, select Math. |
| 2. | With the x= radio button selected, click "Curves …". Highlight c1: Raw Test Data and click Select to insert the original data curve's x-values for this new curve. |
| Note | The nomenclature p1w1c1.x is interpreted as page 1, window 1, curve 1, x-value. See the HyperGraph User's Guide for more details. |
| 3. | With the y= selected, click Functions …. Select runningAverage in the list of functions and click OK. This inserts the function into the expression with a blank set of arguments. Recall from above that the first argument is the data curve, which can be inserted similarly as in the previous step, and the second argument is the number of values used in the average, which can be set to four here. |
| 4. | Click Apply to plot the averaged value curve.
|
See Also:
HMath-1000: Editing, Executing, Saving, and Plotting in HyperMath
HMath-1010: Working with HyperMath Authoring Mode
HMath-1020: Working with HyperMath Debugging Mode
HMath-2000: Working with HyperMath – Arithmetic and Relational Expressions and Control Structures
HMath-2010: Working with HyperMath – Logical and Relational Expressions and Control Structures
HMath-2020: Working with HyperMath – Functions and Matrix Operators
HMath-2030: Working with HyperMath – Plot Commands
HMath-3000: Working with HyperMath – String Library
HMath-3010: Working with HyperMath – Input/Output Library
HMath-3020: Working with HyperMath – Input/Output Library Continued
HMath-3030: Working with HyperMath – Batch Mode
HMath-4000: Using HyperMath Functions for Curve Fitting
HMath-4001: Using HyperMath for Material Characterization
HMath-4010: Solving Ordinary Differential Equations
HMath-4020: Solving Differential Algebraic Equations
HMath-4030: Optimization Algorithms in HyperMath
HMath-5000: Using HyperMath in HyperView Results Math
Hmath-5001: Post-processing Results from FEA
HMath-5003: HyperMesh-HyperMath Cross Execution of a Tcl Script
HMath-5004: HyperMesh-HyperMath Cross-debugging of a Tcl Script


