This tutorial explains how to:
| • | Edit, execute, and save files. |
| • | Plot and manage screen space. |
| • | Use the Project Browser to manage files and save the project. |
Step 1: Edit, execute, and save files.
| 1. | Launch HyperMath in the HyperMath GUI. |
Upon launch, a new file is automatically created in the editor named Untitled1.hml.
| 2. | Enter print("This is a tutorial") in the editor and click the Run File icon,  , from the toolbar. , from the toolbar. |
The contents of the print statement are displayed in the command window at the bottom of the application.
| 3. | Save the file by clicking the Save File icon, , from the File menu. , from the File menu. |
The Save As dialog is displayed.
| 4. | Enter Demo.hml for the filename, pick a location in which to save it, and click Save. |
Note the new filename is reflected in the Project Browser on the left.
| 5. | From the View menu, select File Browser. |
The browser is displayed on the right.
| 6. | Select the file Demo_NLFit.hml, right-click on, and select Open. |
This opens the file in the editor (double-clicking on the file works, too).
Step 2: Plot and manage screen space.
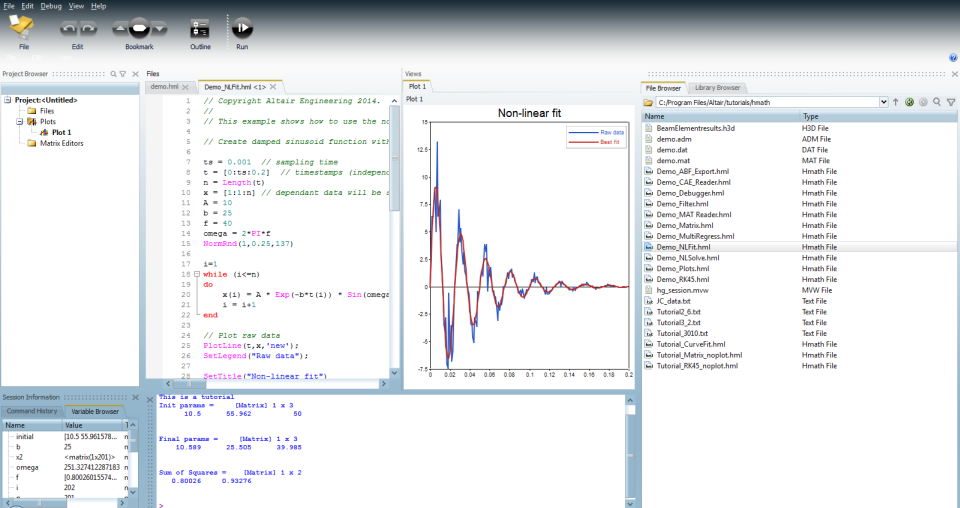
| 1. | Evaluate this file using the Evaluate toolbar’s Run File icon, . |
A plot pane is tiled next to the editor pane. The plot is automatically named Plot 1 and is displayed in the Project Browser under the section Plots in Script 1. This indicates the plot was produced from a file from Script 1.
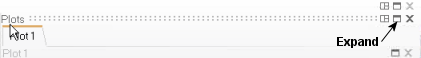
| 2. | Click the expand icon,  , at the top right corner of the plot pane. The plot pane is lined up with the title Plots in the top left corner. , at the top right corner of the plot pane. The plot pane is lined up with the title Plots in the top left corner. |
The plot pane is expanded to cover the editor.
| 3. | Click the icon again (which has collapsed now) to go back to tiled display. |
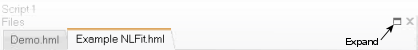
| 4. | Similarly, expand the editor by clicking on its expand icon at the top right corner of the editor pane. The editor panel is lined up with the title Files. |
The editor is expanded to cover the plot.
| 5. | Click the icon again (which has collapsed now) to go back to tiled display. |
| 6. | Right-click on the filename Demo.hml in the Project Browser on the left and select Close. |
This closes the file in the editor but it remains open in the Project Browser with a dimmed icon.
| 7. | Right-click again on the name and select Open. |
The file is re-displayed and the icon is undimmed.
| 8. | Right-click on the filename and select Close and Remove. |
The file is closed and removed from the Project Browser.
| 9. | To open it again, click the Open File icon,  , from the File menu and locate the file via the Open File dialog that is displayed. , from the File menu and locate the file via the Open File dialog that is displayed. |
| 10. | Click on the file name and select Open. |
The file is opened in the editor and is displayed in the Project Browser again.
| 11. | Right-click the Files folder in the Project Browser and select Add Existing File… from the options. |
The Add Existing File dialog is displayed.
| 12. | Locate the file Demo_Debugger.hml in the tutorials folder and click Open. |
The filename is added to the Project Browser, but is not opened in the editor (indicated by the dimmed icon). To open it, right-click on the filename and select Open.
| 13. | Click the New File icon,  , from the File menu to create a new file. It is automatically named Untitled2.hml. , from the File menu to create a new file. It is automatically named Untitled2.hml. |
| 14. | Enter PlotLine([1:10],[1:10],"new") and click the Evaluate File icon from the toolbar. |
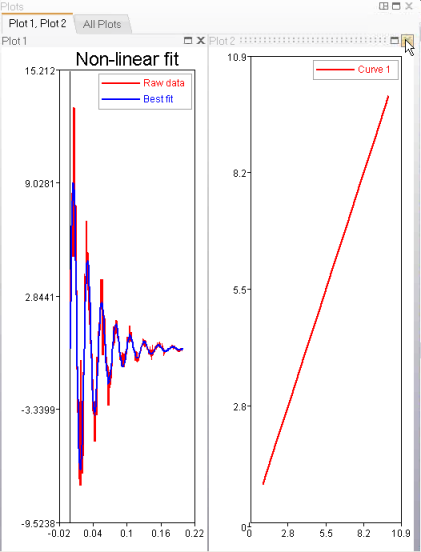
This creates another plot named Plot 2. Each plot is shown on its own tab and also as stacked in a separate tab titled All Plots.
| 15. | To layout both plots side-by-side, click the Layout icon,  , in the top right corner of the plot pane. The plot pane is lined up with the title Plots in the top left corner. , in the top right corner of the plot pane. The plot pane is lined up with the title Plots in the top left corner. |
| 16. | Select the option two vertical,  , (with a vertical line). , (with a vertical line). |
The plots are displayed side by side.
| 17. | Right-click on Plot 2 and select Hide. |
The plot is hidden, but remains in the Project Browser. This is indicated by the dimmed icon next to its name.
| 18. | To unhide it, right-click on the name and select Show. The plot reappears. |
| 19. | Right-click on it again and select Delete. The plot is dismissed all together. |
| 20. | Right-click on the red curve in Plot 1. |
A floating palette is displayed carrying various options to change the attribute of the curve.
| 21. | Select the Symbol list and pick a symbol. |
| 22. | Similarly, select a line color other then red. Left-click to dismiss the palette. |
| 23. | Right-click on the x-axis to see the axis attribute palette (expand the plot if necessary to see the entire palette). Change items as needed. |
| 24. | Left-click to dismiss the palette. Do the same for the y-axis. |
| 25. | Drag the legend by holding down the left button and moving the mouse. |
Circle zooming can be done on any region by holding down the mouse roller and drawing a closed region on the plot.
Click the roller will zoom to fit the plot.
Center zooming can be done by turning the mouse roller.
| 26. | If you have expanded the plot, return it to tile display. Then, display the file Demo_NLFit.hml in the editor by clicking on its tab, for example. Hold down the CTRL key and scroll the mouse roller to change the font size. |
| 27. | Click the tab for file Untitled2.hml to display it. |
| 28. | Select the entire line PlotLine([1:10],[1:10],"new") and drag it using the left mouse button on to the Command window until you see a static cursor next to the prompt (>). Release the mouse. |
This copies the text to the command line.
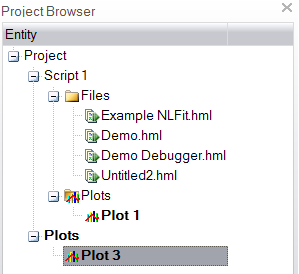
This creates another plot named Plot 3 in a new plot pane. It is displayed in the Project Browser under the section Plots at the same level as Script 1. This indicates the plot was generated from the Command window and not from the editor.
Note that the command is now listed in the Command History window.
| 30. | Right-click on the item and select Execute. |
This creates another identical plot named Plot 4 and lists it under the section Plots in the Project Browser. The plots can be laid out just like the ones created in the editor.
You may have noticed that the plots created at the Command window occupied the entire area where the editor and previous plots used to be. This is because the Plots section is active now, indicated by the bold faced section name.
| 31. | To see the editor, click Script 1 in the Project Browser. It becomes bold faced. |
| 32. | To see the contents of the sections Plots and Script 1, right-click on Project in the Project Browser and select the two vertical option,  , from the Layout option. , from the Layout option. |
This displays both sections side-by-side. Previously, it was in single layout mode and hence displayed one section at a time.
Step 3: Use the Project Browser to save the files in a project.
We will only save the two files Demo_NLFit.hml and Demo_Debugger.hml as part of the project and remove the other two files from the project.
| 1. | Right-click on the filename Untitled2.hml in the Project Browser and select Close and Remove. |
| 2. | Select No when asked to save. |
This will remove it from the editor, too.
| 3. | Right-click on the filename Demo_Debugger.hml and select Remove. |
This removes it from the Project Browser only and keeps it open in the editor.
| 4. | From the File menu, select Save Project. |
A dialog box is displayed to specify the project name.
| 5. | Pick a location and enter Demo.aprj in the File name field and click Save. |
You have the option to save the plot along with the files as part of the project. This project can be retrieved in a new session via the File > Open menu options and selecting Project from the Files of type field.
See Also:
HMath-1010: Working with HyperMath Authoring Mode
HMath-1020: Working with HyperMath Debugging Mode
HMath-2000: Working with HyperMath – Arithmetic and Relational Expressions and Control Structures
HMath-2010: Working with HyperMath – Logical and Relational Expressions and Control Structures
HMath-2020: Working with HyperMath – Functions and Matrix Operators
HMath-2030: Working with HyperMath – Plot Commands
HMath-3000: Working with HyperMath – String Library
HMath-3010: Working with HyperMath – Input/Output Library
HMath-3020: Working with HyperMath – Input/Output Library Continued
HMath-3030: Working with HyperMath – Batch Mode
HMath-4000: Using HyperMath Functions for Curve Fitting
HMath-4001: Using HyperMath for Material Characterization
HMath-4010: Solving Ordinary Differential Equations
HMath-4020: Solving Differential Algebraic Equations
HMath-4030: Optimization Algorithms in HyperMath
HMath-5000: Using HyperMath in HyperView Results Math
HMath-5001: Post Processing Results from FEA
HMath-5002: Registering a Function in HyperGraph 2D
HMath-5003: HyperMesh-HyperMath Cross Execution of a Tcl Script
HMath-5004: HyperMesh-HyperMath Cross-debugging of a Tcl Script


