In this tutorial, the HyperMath client will be explored while in the Debugging Mode.
Step 1: Launch HyperMath.
| 1. | From the Start menu, select All Programs > Altair HyperWorks > HyperMath. |
This launches HyperMath in the HyperMath GUI. Notice that by default, a file named Untitled1.hml exists in the Editor window. By default, the Authoring Mode is displayed as well.

Step 2: Open a file from the File menu and enter the Debugging Mode.
| 1. | From the File menu, select Open. |
| 2. | From the Open File dialog, select the file Demo_Debugger.hml, located in the hmath folder, and click Open. |
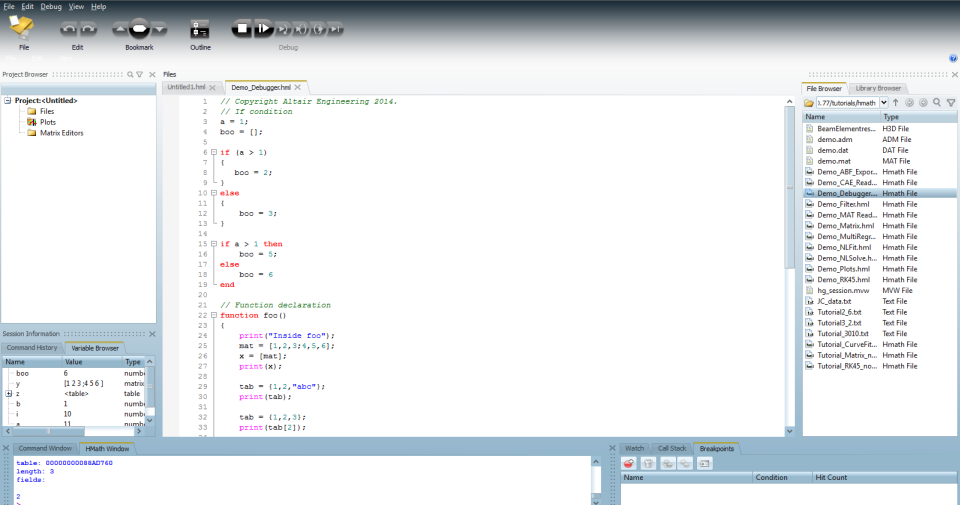
This opens a new tab in the Editor window titled Demo_Debugger.hml. This tab is now the active tab, indicating that this file is the active file.
| 3. | From the Debug menu, select Start Debugging. |
Additional items in the toolbar and additional windows are loaded into the GUI. These include the Watch window, Call Stack window and the Breakpoints window.
Step 3: Add a breakpoint and begin debugging the file.
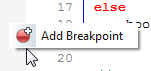
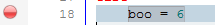
| 1. | A breakpoint is added to the debugging session by left-clicking in the margin to the left of the line numbers. Add a breakpoint at line 18. A breakpoint is indicated by a red circle in the margin. |
| 2. | Click the Breakpoints tab, located next to the Call Stack tab, at the bottom of the GUI. |
A breakpoint is now listed and located at line 18.

| 3. | Begin debugging the file by clicking the Run File icon,  , from the Debug toolbar. , from the Debug toolbar. |
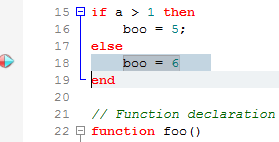
Due to the breakpoint at line 18, the execution of the file has stopped at line 18. In addition to the red circle indicating the breakpoint at line 18, there is also a blue triangle at this line. The blue triangle indicates that this is the next line to be executed.
Step 4: Inspect variable values using the Editor and Watch windows.
| 1. | In the Editor window, hover the mouse over the variable boo on line 18. A pop-up window appears with the current value of the variable boo. |
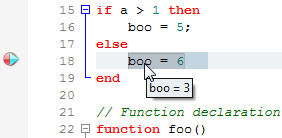
| 2. | Variables can also be inspected using the Watch window. The Watch window is located in the lower left corner of the HyperMath GUI. In the Editor window, using the left mouse button, highlight the variable boo, then drag the variable from the Editor window into the Watch window. |
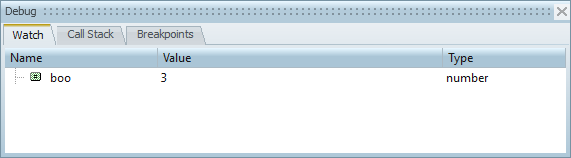
The value of boo is currently 3.
| 3. | Click the Step Over icon,  , in the Debugging toolbar to execute only line 18. , in the Debugging toolbar to execute only line 18. |
The value of boo has changed. This is verified by either hovering the mouse over the variable in the Editor window or by inspecting the value in the Watch window.
| 4. | The blue arrow indicating the next line to be executed is now at line 36. Use Step Over, , to move the execution point to line 38. |
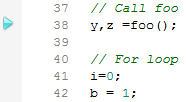
Step 5: Enter in the function foo and investigate the Call Stack window.
| 1. | To enter the function foo, click the Step Into icon,  . . |
Selecting Step Over will actually execute the function foo. If you want to execute each line inside the function foo individually, select Step Into instead.
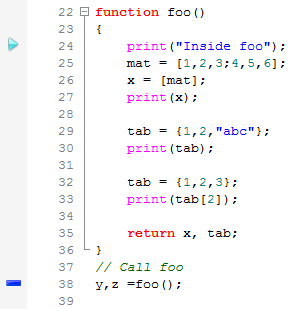
Once Step Into has been selected, a blue bar appears at line 38 and the blue triangle moves to line 24. The blue bar indicates the calling point to the current function. The blue triangle represents the next execution point. By selecting Step Into, the execution point has moved to the first line in the function foo.
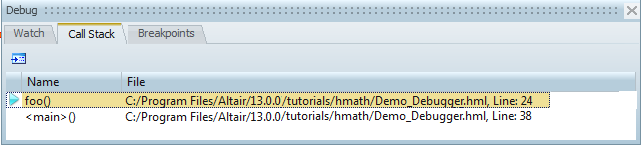
| 2. | Click on the Call Stack window tab. Investigate the contents inside the Call Stack window. The current execution point (line 24) is listed as well as the calling point to the function foo (line 38). |
Step 6: Investigate variables in the function foo using the Editor window and the Watch window.
| 1. | Click Step Over, , to execute each line, one at a time, until line 26 is reached. |
| 2. | Hover the mouse over the variable mat to investigate the value. |
Notice that the variable mat is a matrix. Hovering the mouse over the matrix variable allows you to investigate all the matrix values.
| 3. | Click Step Over, , a few more times until line 30 is reached. |
| 4. | Under the Name column in the Watch window, type in the variable name tab. |
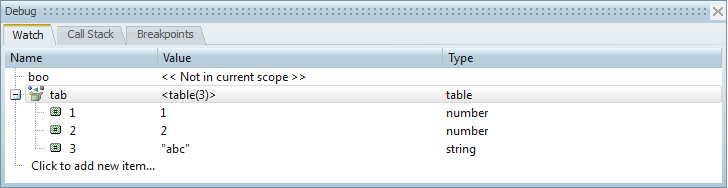
The contents of the variable tab are updated in the Watch window. The Type column indicates that the variable tab is a table and there are three entries in the table. The values can be seen under the Value column and the Type column indicates if the entry is a number or string.
| 5. | Click Step Over again, , a few more times until line 33 is reached. |
In the script, line 32 resets the values of the table. As a result, the table’s third entry is updated to the number 3. Observe how this value has been updated in the Watch window.
| 6. | Using the Watch window, update the value of the third entry in the table tab and change it to 100. This is done by clicking under the Value column for the third entry in the table, entering the new value, and pressing ENTER on the keyboard. |
| 7. | Next to the Watch window tab, click the Command window tab. |
The Command window will be used to view the result from line 33.
| 8. | Click Step Over, , once to execute line 33. |
Line 33 prints the third value in the variable tab. This printed result can be seen in the Command window. Notice that the value that is printed in the updated value of 100.
| 9. | From the Debugging toolbar, click the Step Out icon,  , to execute the rest of the function and exit it in a single step. The marker moves to the next execution point in the path, which is at line 41. , to execute the rest of the function and exit it in a single step. The marker moves to the next execution point in the path, which is at line 41. |
Step 7: Use the Step Until option in the Debug toolbar.
| 1. | Scroll down and place the cursor at line 52. |
| 2. | Click Step Until,  , in the Debugging toolbar. , in the Debugging toolbar. |
This executes the rest of the lines and stops at the line with the cursor. This is convenient if you do not want to add a breakpoint at a line because a breakpoint would stop the execution of the code at this line every time. Using Step Until only stops the execution at this line this one time.
| 3. | Click the Watch window tab to activate it. |
| 4. | Right-click in the Watch window and select Remove All. Select Yes to the message that prompts if you want to delete all entries. |
This clears the Watch window to allow for a clean look at the variables to be inspected.
| 5. | Enter the variable a in the Watch window. Note its current value. |
| 6. | Click Step Over, , once inside the for loop to observe its value change incrementally in the Watch window. |
Step 8: Add a condition to the breakpoint
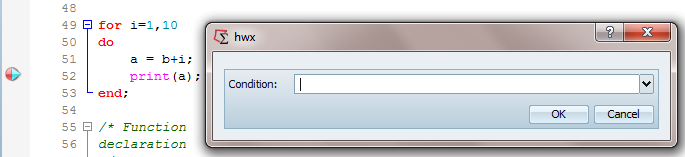
| 1. | Left-click on the left margin at line 52 to add a breakpoint. Right-click on the breakpoint to select Condition. |
This opens a dialog box for specifying the break condition.
| 2. | Type a == 5 and click OK. |
| 3. | Click the Run File icon, , to continue until the execution stops again at the breakpoint, which is only when the above condition is met as seen from the Watch window. |
Step 9: Add another breakpoint, enter the function zoo, and observe the Call Stack window.
| 1. | Add another breakpoint at line 64. |
| 2. | Click Run File, , to execute the rest of the code and stop at line 64, where the breakpoint is located. |
| 3. | Line 64 calls the function zoo and passes the argument 10. Click Step Into, , to enter the function zoo and move the execution point to the first line in the function. |
| 4. | Click Step Over, , twice to move to line 61. line 61 calls the function foo. |
| 5. | Click Step Into, , to enter the function foo and move the execution point to the first line in the function. This moves the marker for the next execution point to line 24. |
| 6. | Observe the Call Stack window. This displays the execution path through all functions to the current marker location. At the top, it shows the inner most function the execution is currently in (function foo), followed by the next outer function, zoo, which is followed by the main function level. |
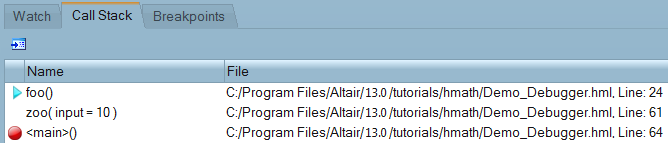
Also note the blue marker in the editor margins at locations where each of these functions were called. These lines are also displayed in the Call Stack window’s second column. This allows you to find which instance of a function call lead to the current location, if there are multiple instances.
| 7. | Double-click the function zoo in the Call Stack window. This steps back to the appropriate function call location to foo. |
| 8. | Variable values at this call instance can also be inspected. Hover the mouse over the variable z to inspect its value. |
Step 10: Stop Debugging and exit the Debugging Mode.
| 1. | Click Stop Debugging,  , in the debugging toolbar to exit the Debugging Mode. , in the debugging toolbar to exit the Debugging Mode. |
| 2. | This returns the HyperMath GUI to the Authoring Mode. At this point, you can continue with any authoring mode activities. |
See Also:
HMath-1000: Editing, Executing, Saving, and Plotting in HyperMath
HMath-1010: Working with HyperMath Authoring Mode
HMath-2000: Working with HyperMath – Arithmetic and Relational Expressions and Control Structures
HMath-2010: Working with HyperMath – Logical and Relational Expressions and Control Structures
HMath-2020: Working with HyperMath – Functions and Matrix Operators
HMath-2030: Working with HyperMath – Plot Commands
HMath-3000: Working with HyperMath – String Library
HMath-3010: Working with HyperMath – Input/Output Library
HMath-3020: Working with HyperMath – Input/Output Library Continued
HMath-3030: Working with HyperMath – Batch Mode
HMath-4000: Using HyperMath Functions for Curve Fitting
HMath-4001: Using HyperMath for Material Characterization
HMath-4010: Solving Ordinary Differential Equations
HMath-4020: Solving Differential Algebraic Equations
HMath-4030: Optimization Algorithms in HyperMath
HMath-5000: Using HyperMath in HyperView Results Math
HMath-5001: Post Processing Results from FEA
HMath-5002: Registering a Function in HyperGraph 2D
HMath-5003: HyperMesh-HyperMath Cross Execution of a Tcl Script
HMath-5004: HyperMesh-HyperMath Cross-debugging of a Tcl Script


